Diagnosis
"Diagnosis" is a TapDB module that generates reports based on data monitored by TapTap's self-developed crash monitoring SDK (Themis) and provides related log information to help developers efficiently locate and resolve problems.
How to use "Diagnosis"?
The "Diagnosis" feature is available for games that are open to TapPlay, integrated with TapSDK and have Themis enabled. Please refer to the documentation for how to adjust the configuration.
What scenarios can "Diagnosis" cover?
- Monitor crashes, flashbacks and errors generated during the game, and obtain user behavior logs.
What modules are included in "Diagnosis"?
-
Crash analysis: Monitor the crashes and flashbacks generated during the game, provide positioning conditions and reports, and can be specific to a particular user's crash information.
-
Error analysis: Monitor the error reports and custom logs generated during the game, provide location conditions and reports, and can be specific to a particular user's reported information.
-
Label management: upload the label to parse and restore the stack of crashes of APP, and quickly and accurately locate the code location where the user's APP crashed.
How does crash analysis and error analysis work?
The functions of "Crash Analysis" and "Error Analysis" are the same, only the monitoring conditions are different, so they are explained together.
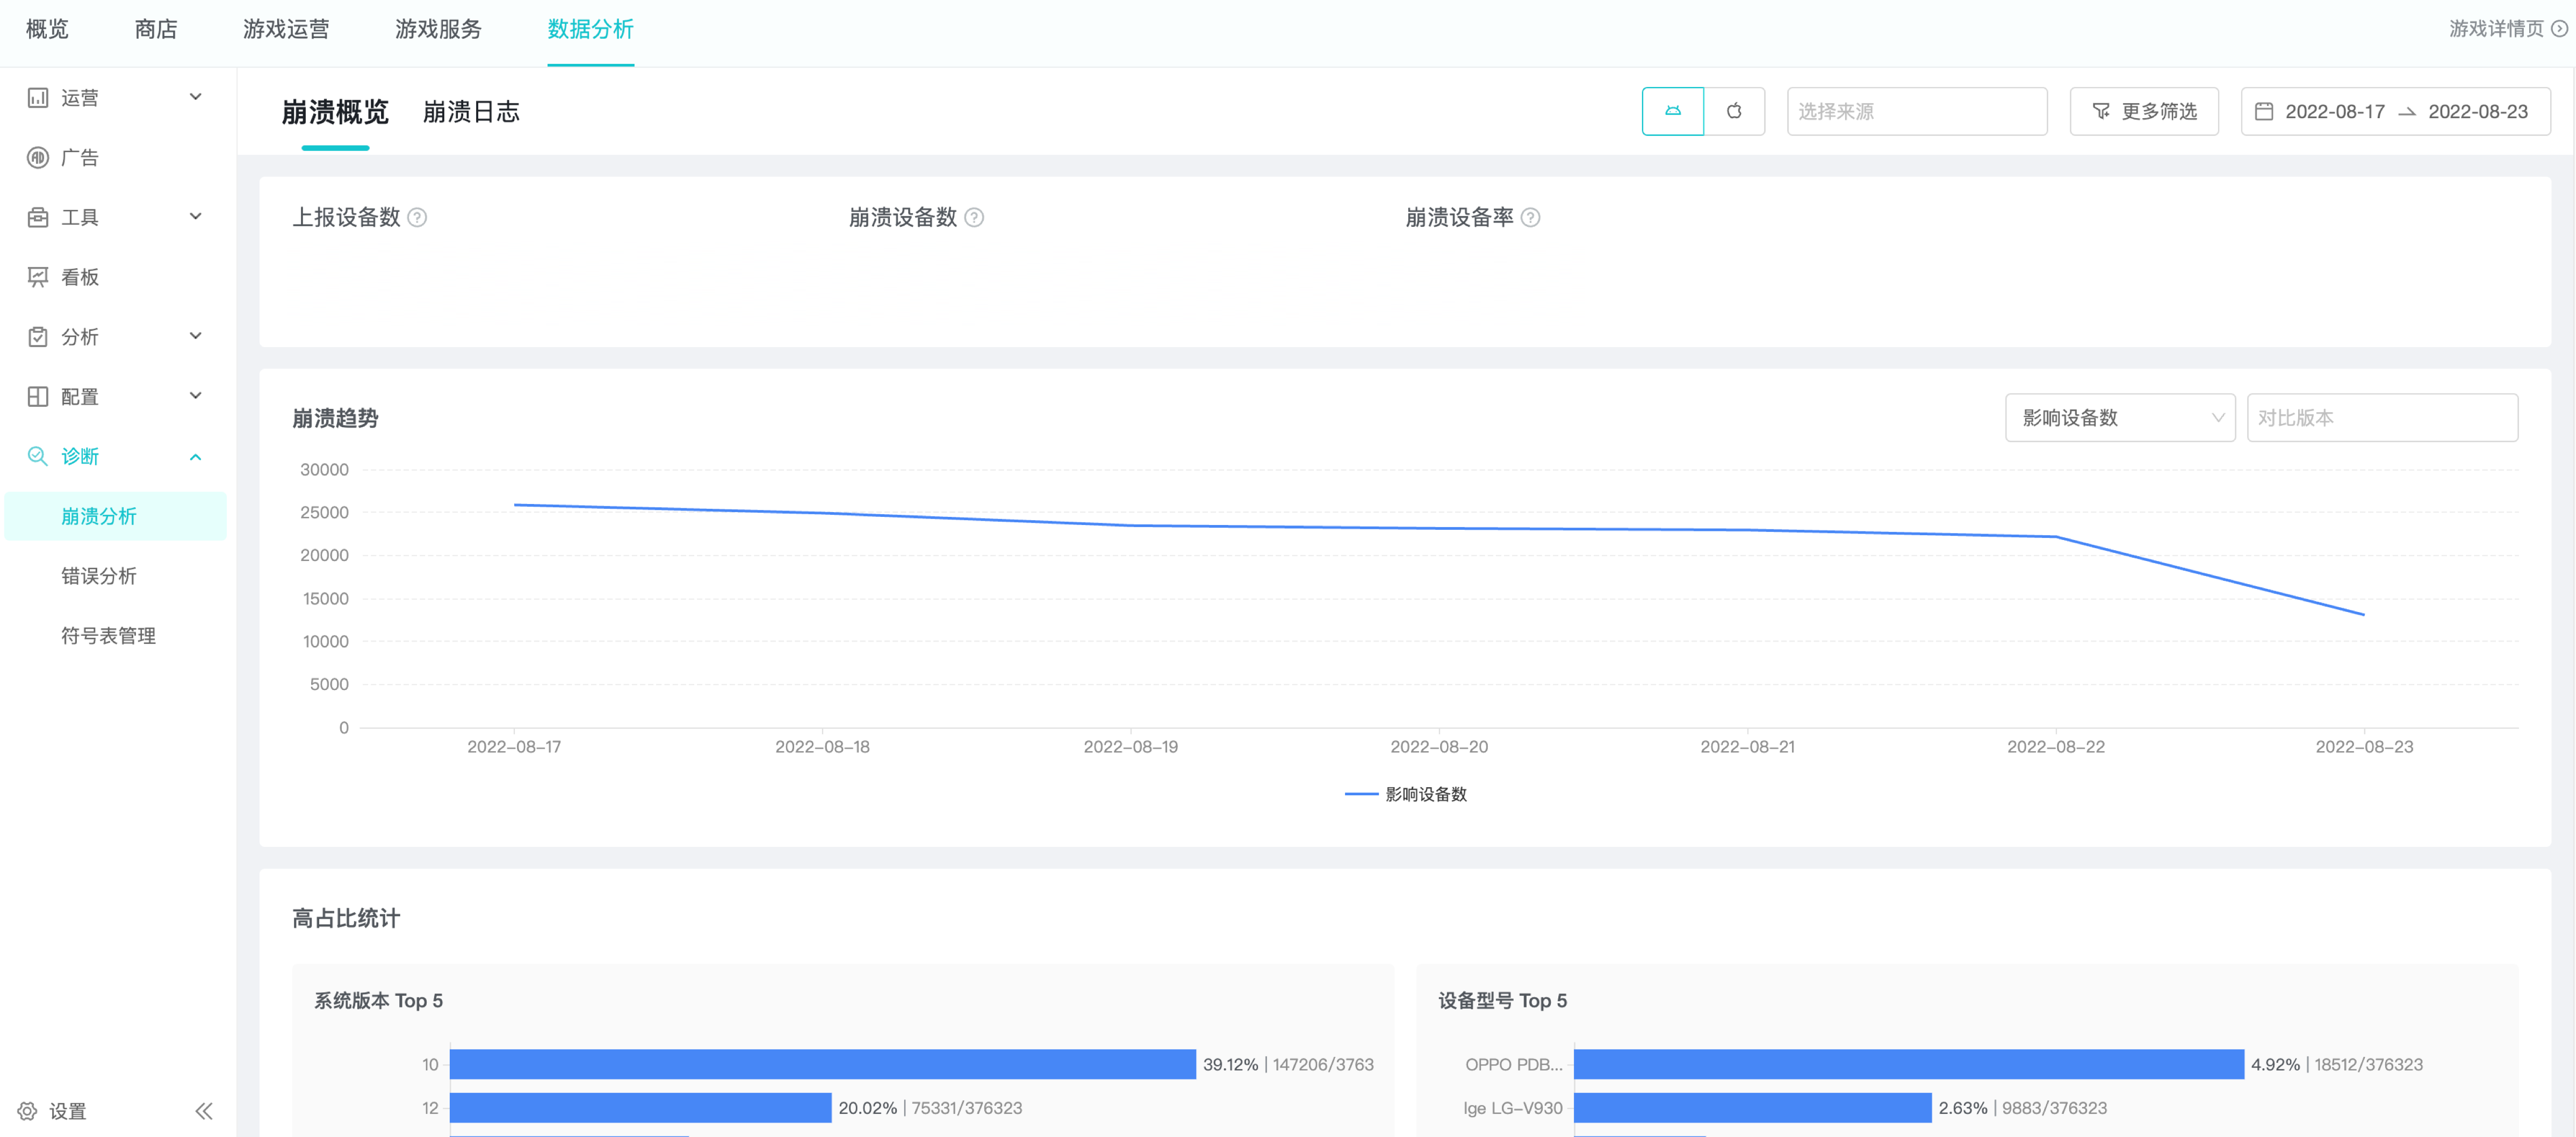
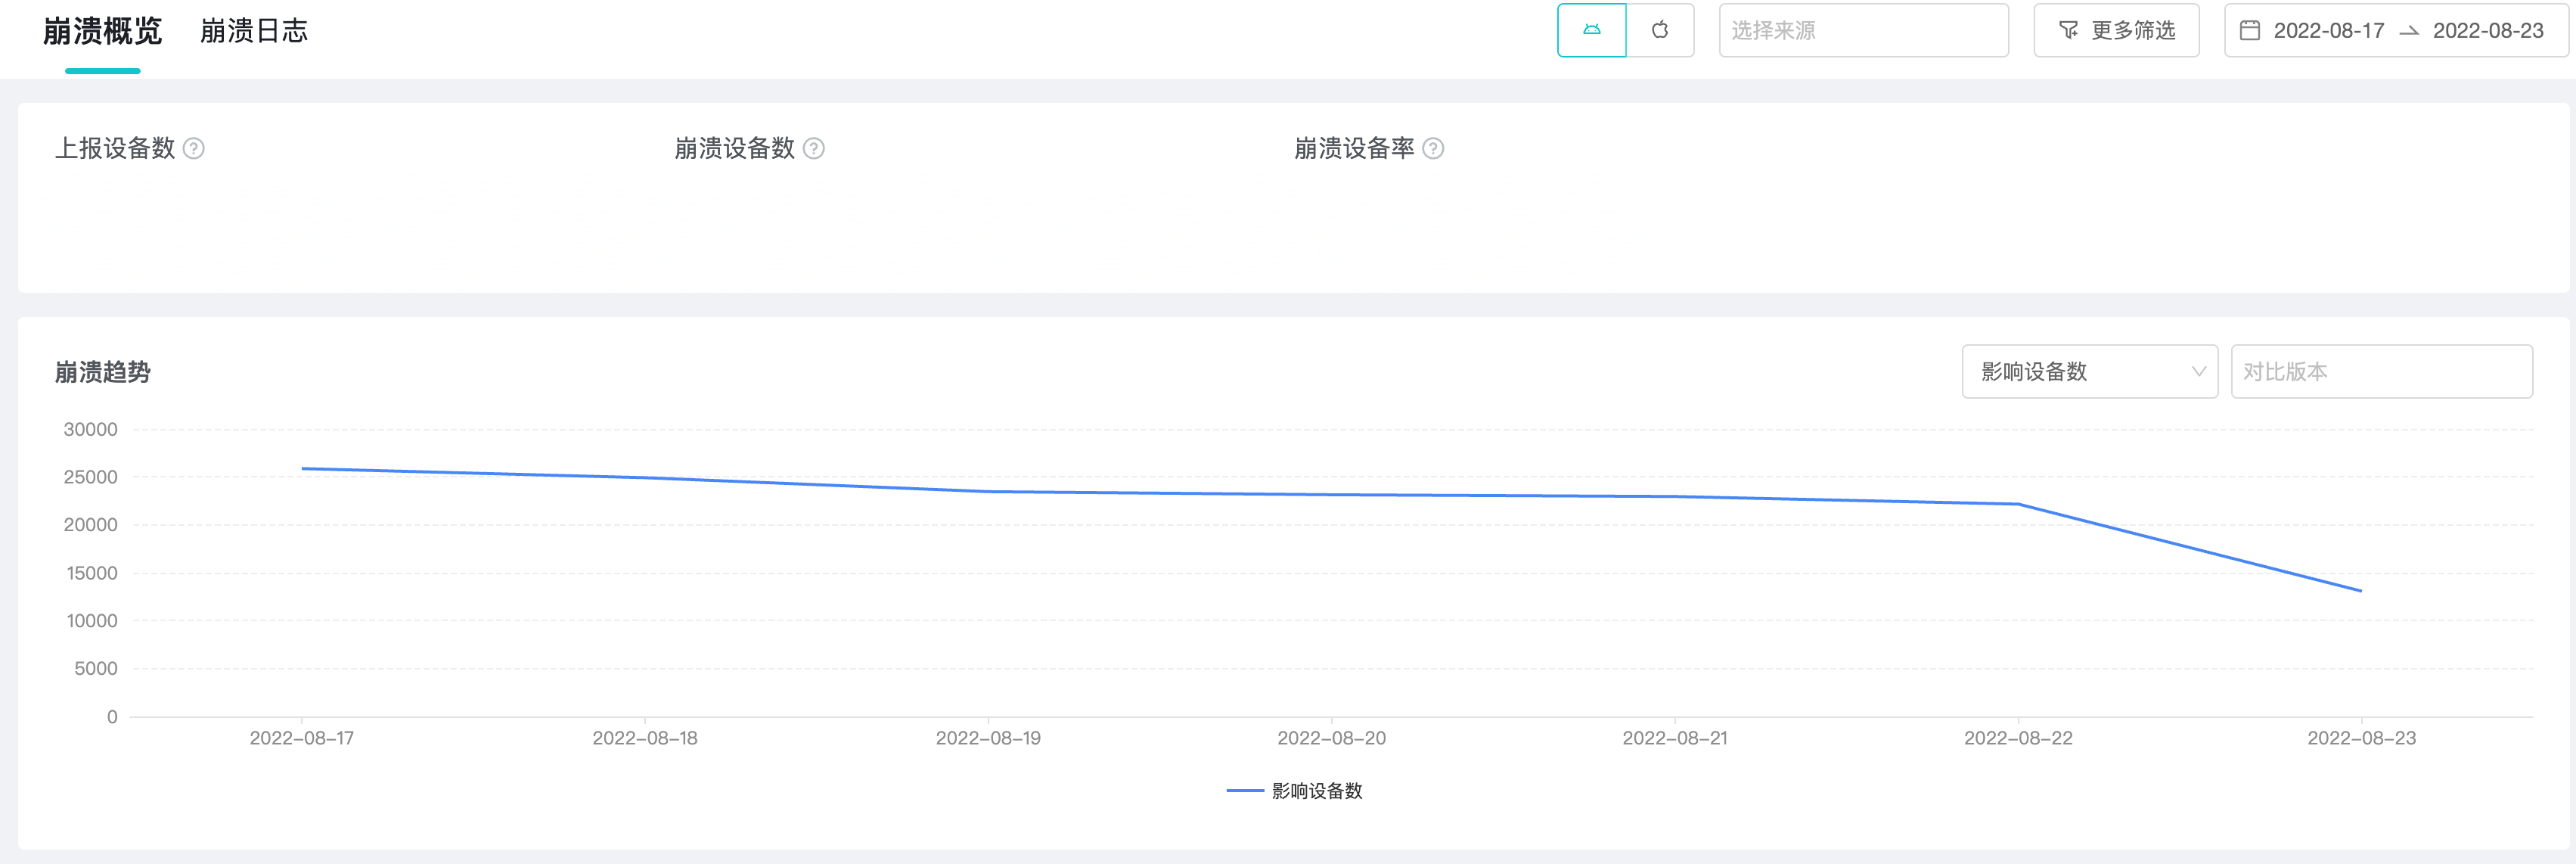
Observe the stability of the program through "Collapse overview”
- Observe the running stability trend of the program in the selected date, and determine whether there is a problem in the selected date by the error reporting rate and the reported trend graph.
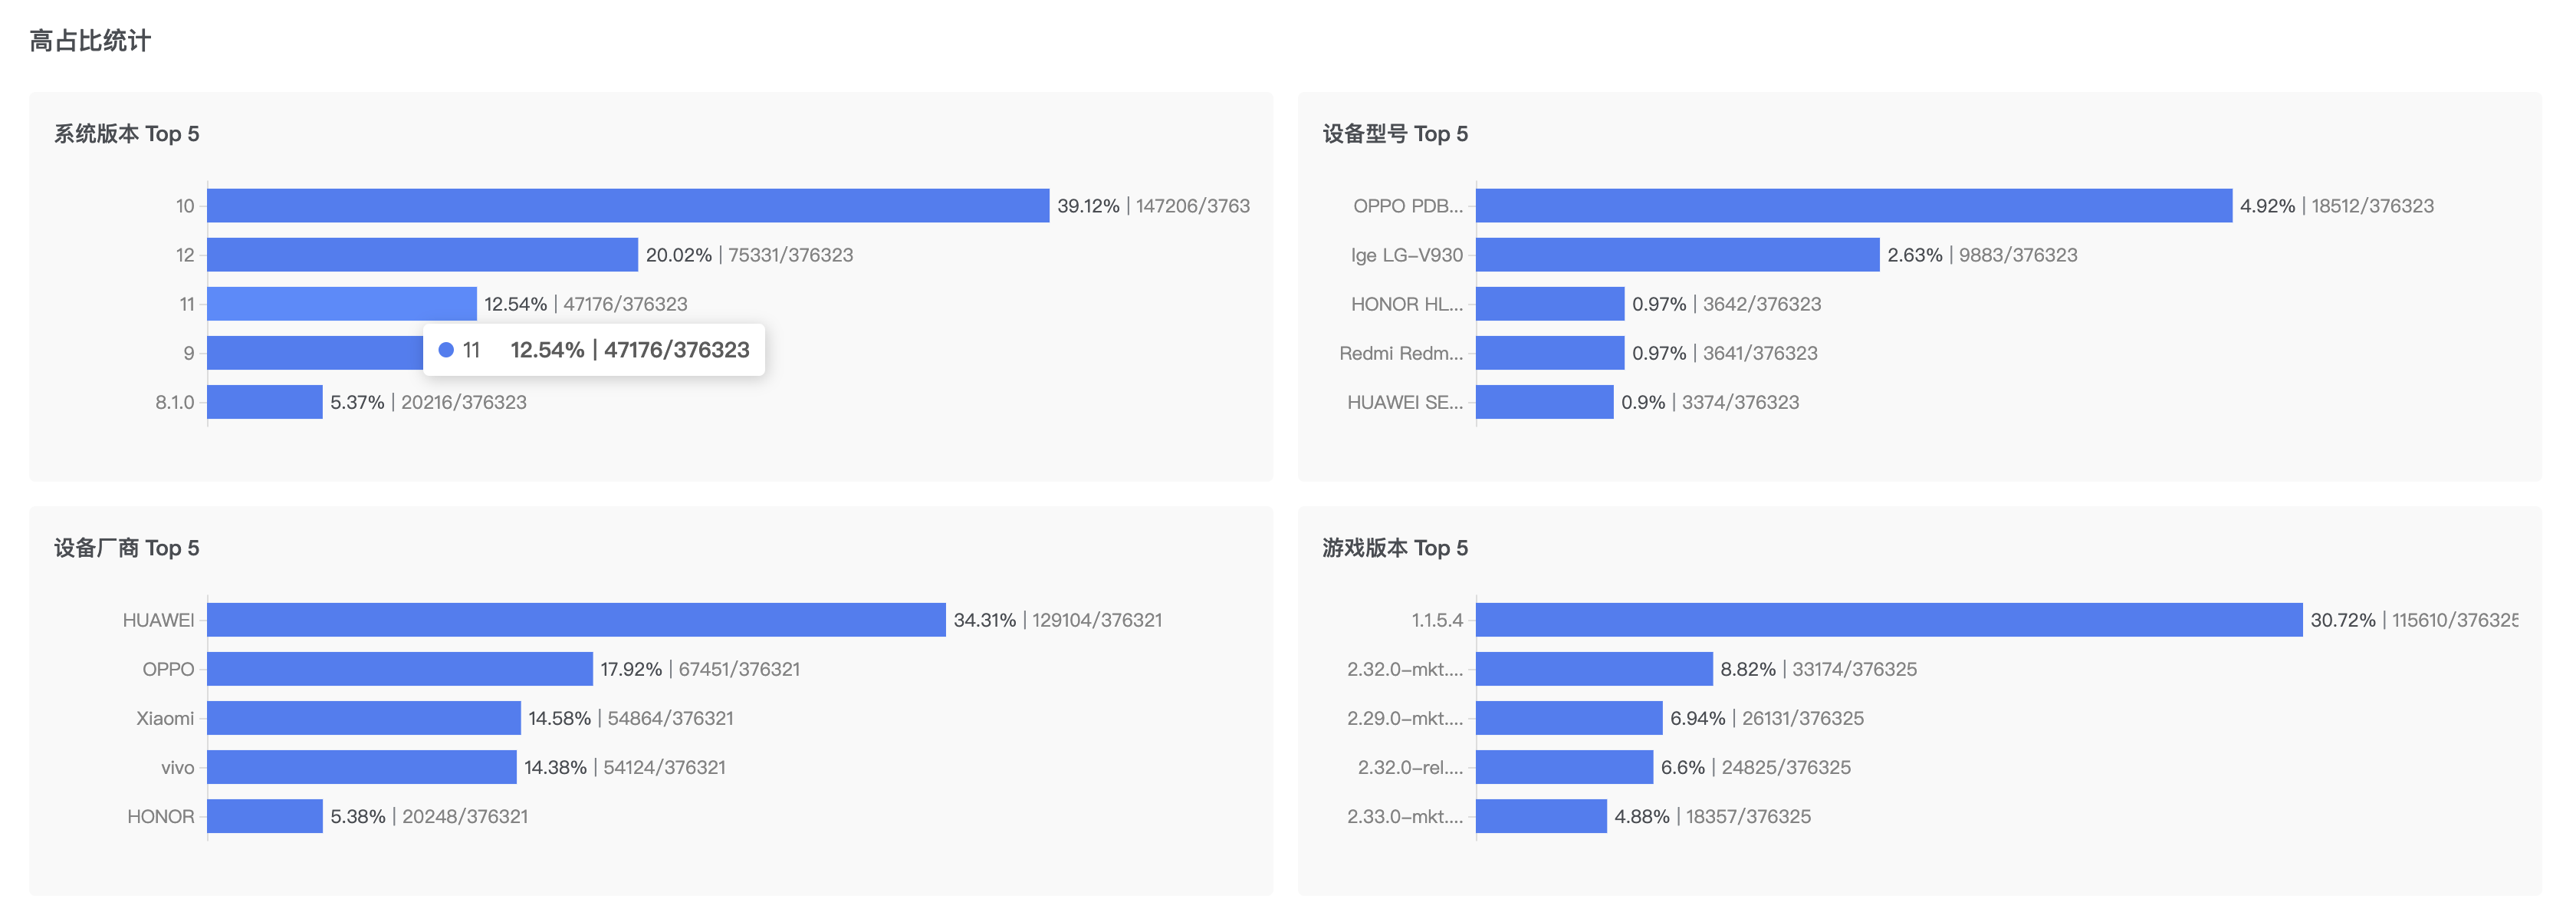
- The "High probability crash in" chart quickly locates the scenarios where the problem may exist. For example, if the game is connected to TapDB and TapPlay is open, it will additionally provide the distribution of the reported game in TapTap app version.
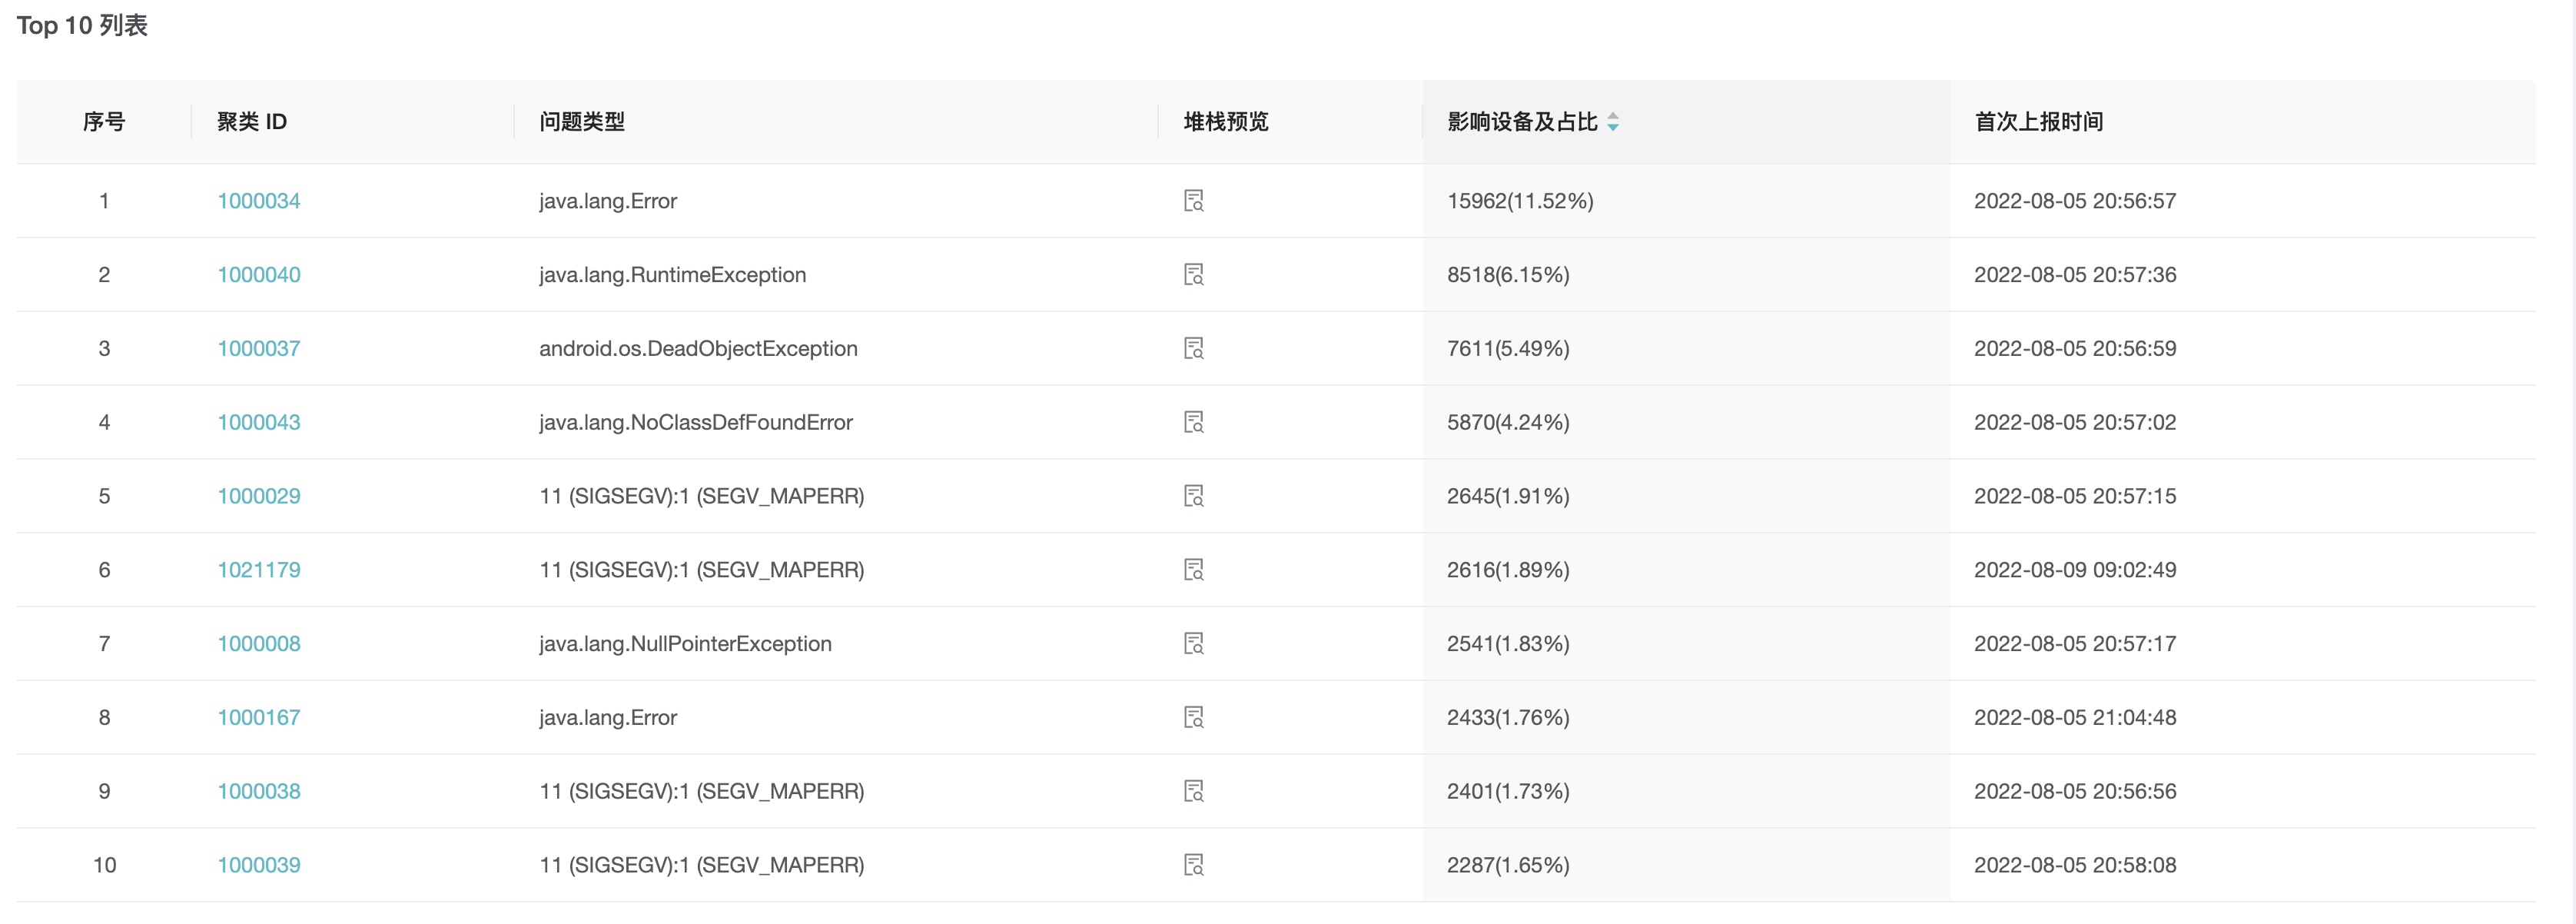
- Go to the details of the most reported issues through the "TOP 10 list" to quickly anchor the issue.
How do I identify the cause of the problem?
-
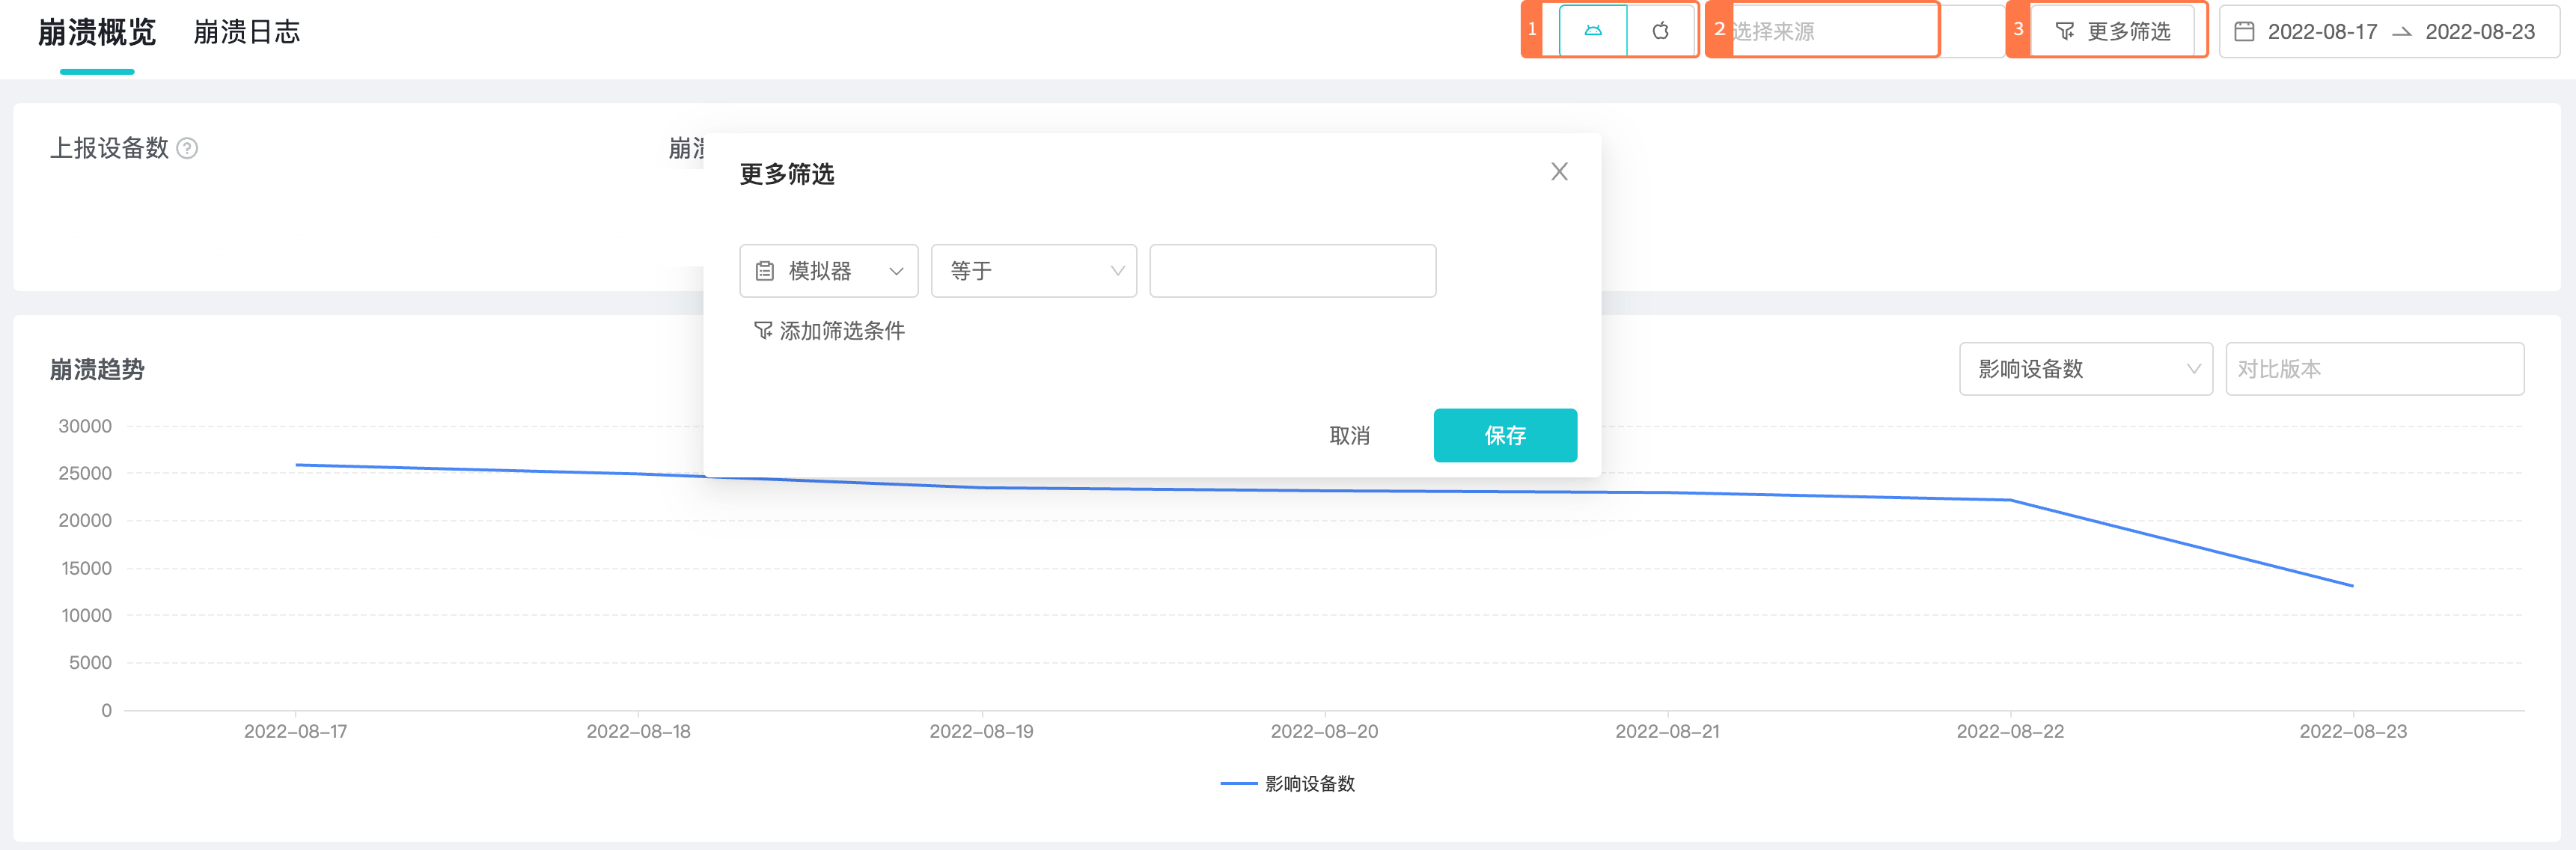
Filter by "Platform" whether the platform you want to view is Andorid or IOS, Android is selected by default.
-
Filter by "Data" which SDK you want to see the data reported, including TapDB and TapPlay.
-
Set the conditions to locate the people who report errors with specific conditions through the filter, after setting the conditions, the data will be reloaded to filter out the information that matches the conditions.
-
Filtering error messages by filtering conditions, the same error reports from different users will be grouped according to characteristics and merged into the same issue ID.
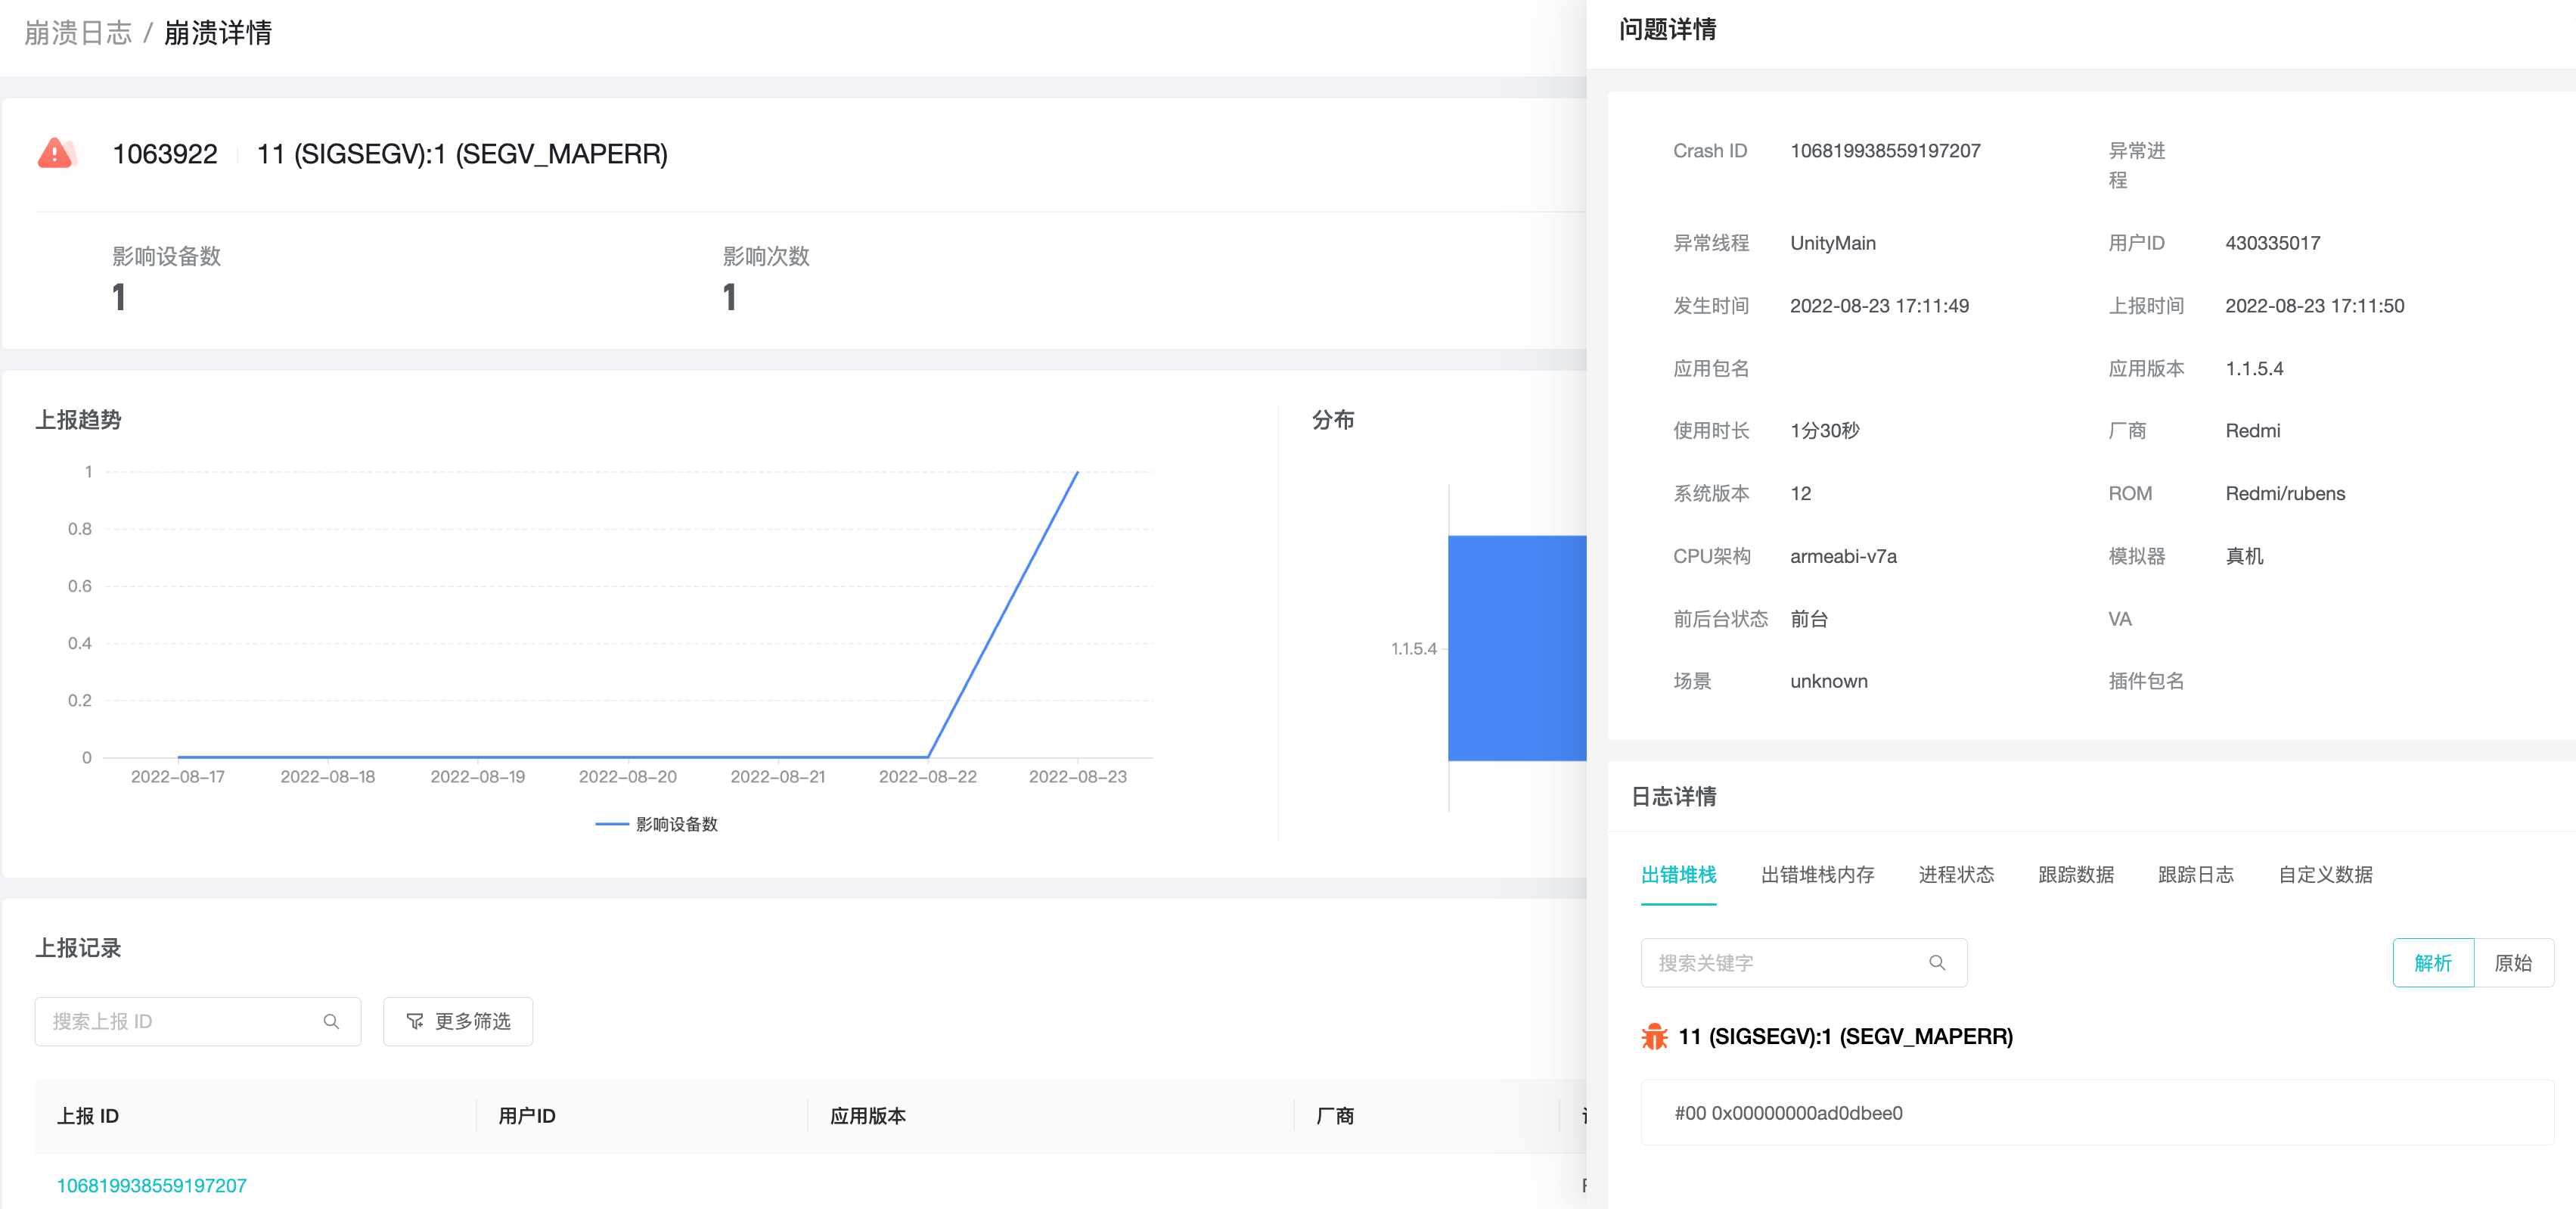
- a. Click on the issue ID to enter the details page, and you can view the trend and distribution of reported issues of this category.
- b. Click the report ID, the sidebar will pop up the error details of the specific user. Developers can locate the cause of the problem according to the "error stack", "trace data" and so on.
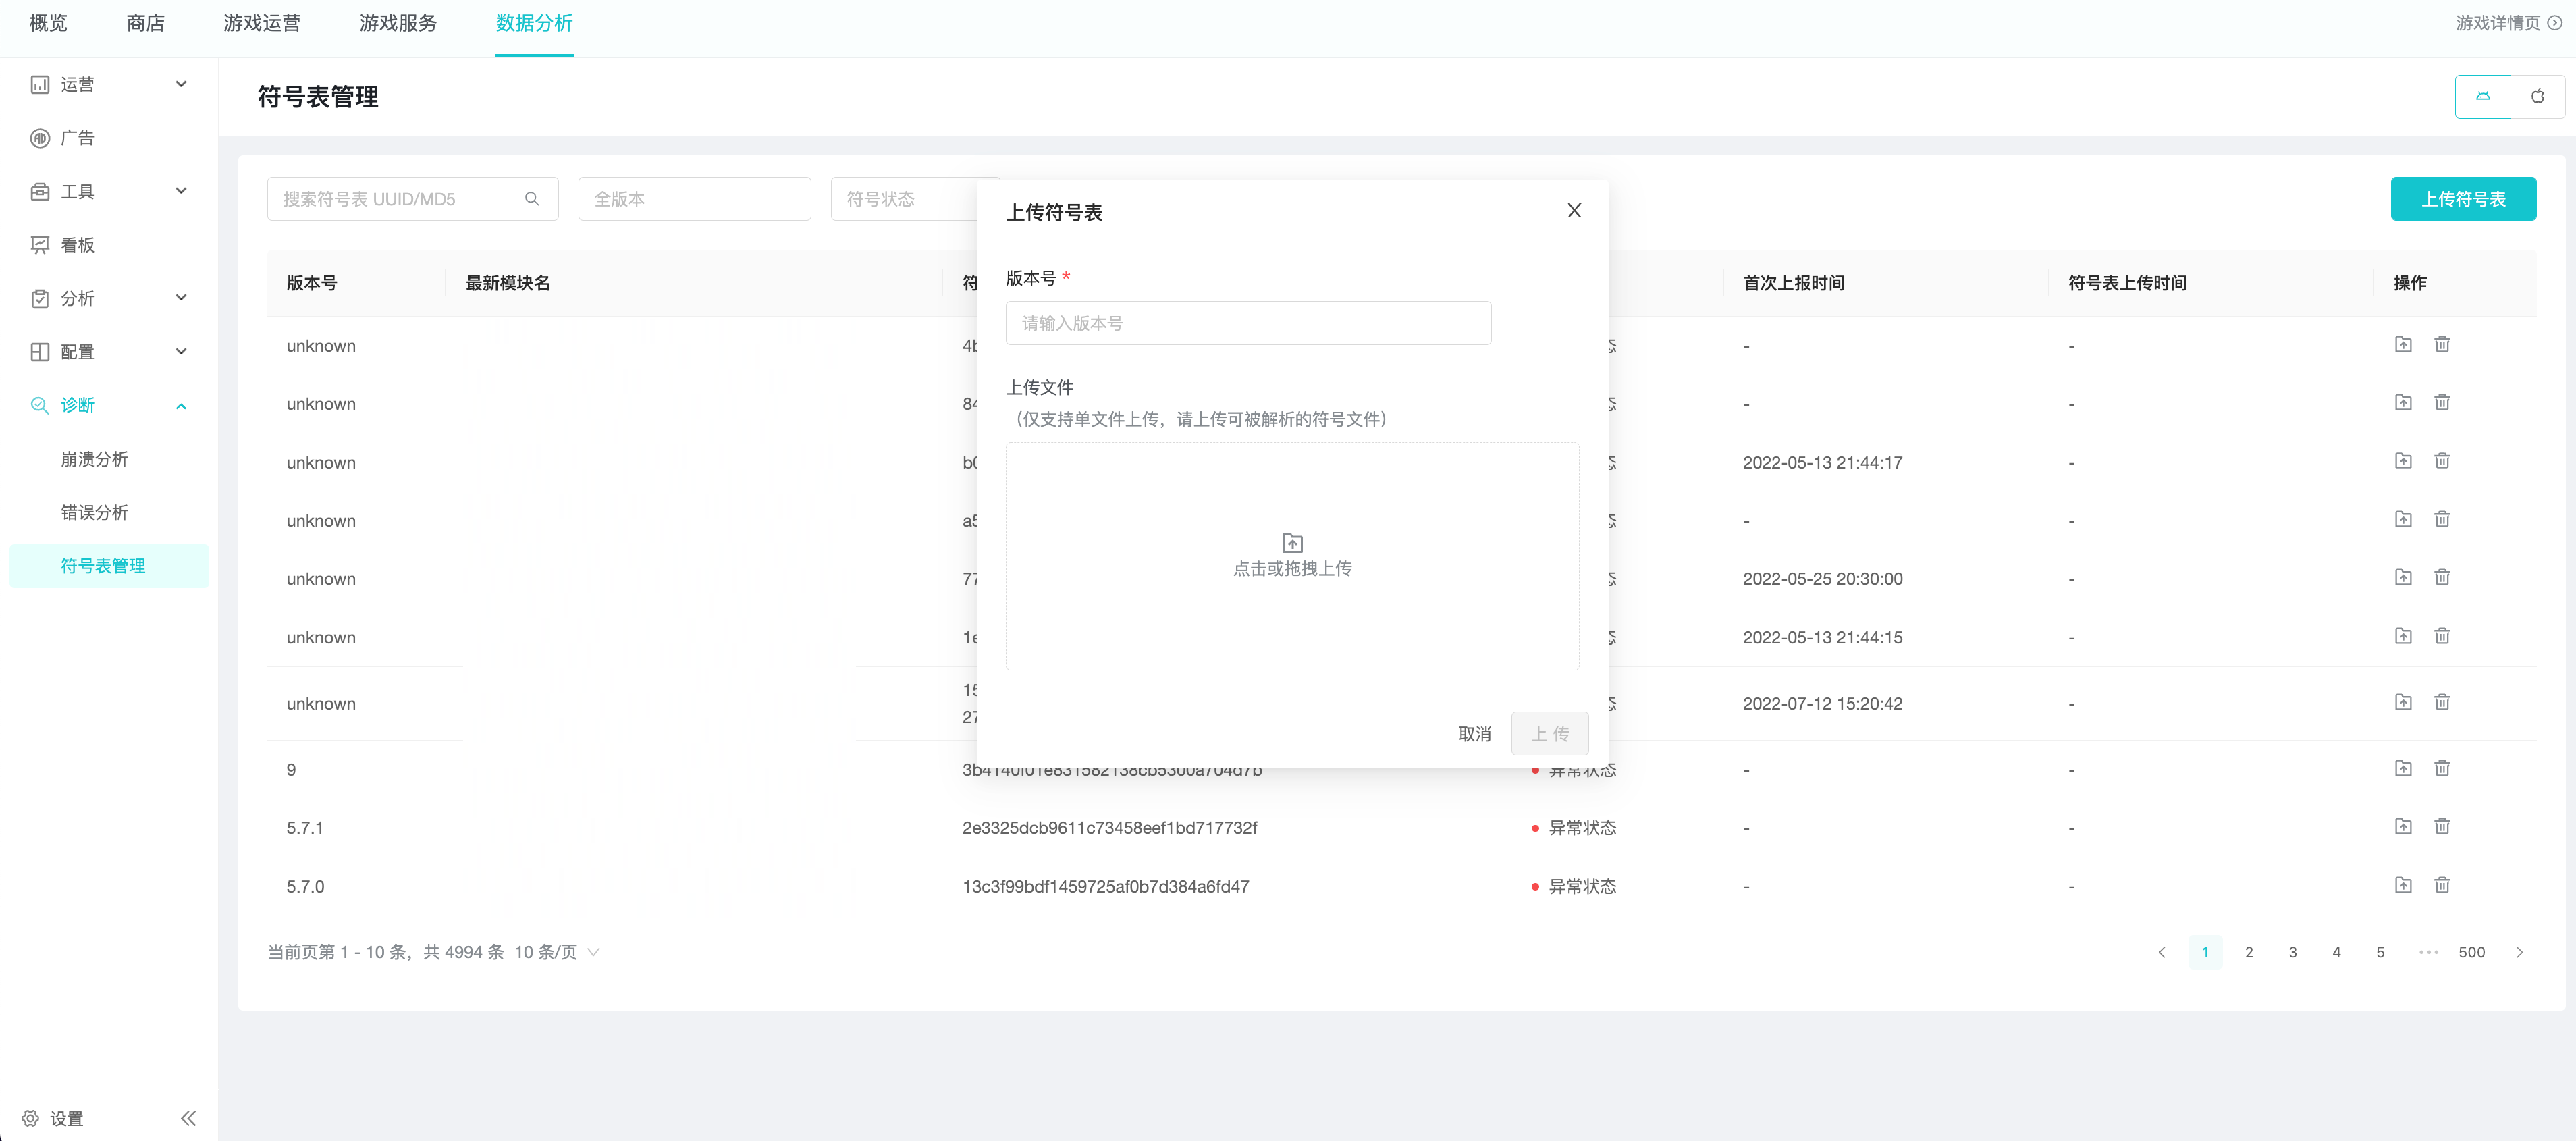
How does the "Label Management" work?
"Label Management" is used to manage the symbol table uploaded by developers, providing the ability to upload, filter, delete, etc. The detailed use process can be seen in the figure below, if you have any questions, you can submit a ticket for consultation.