Retention Analysis
1. Case Introduction
Games are usually updated frequently, so what is the change of retention rate after the update, we can use the function of "Retention Analysis" to analyze it.
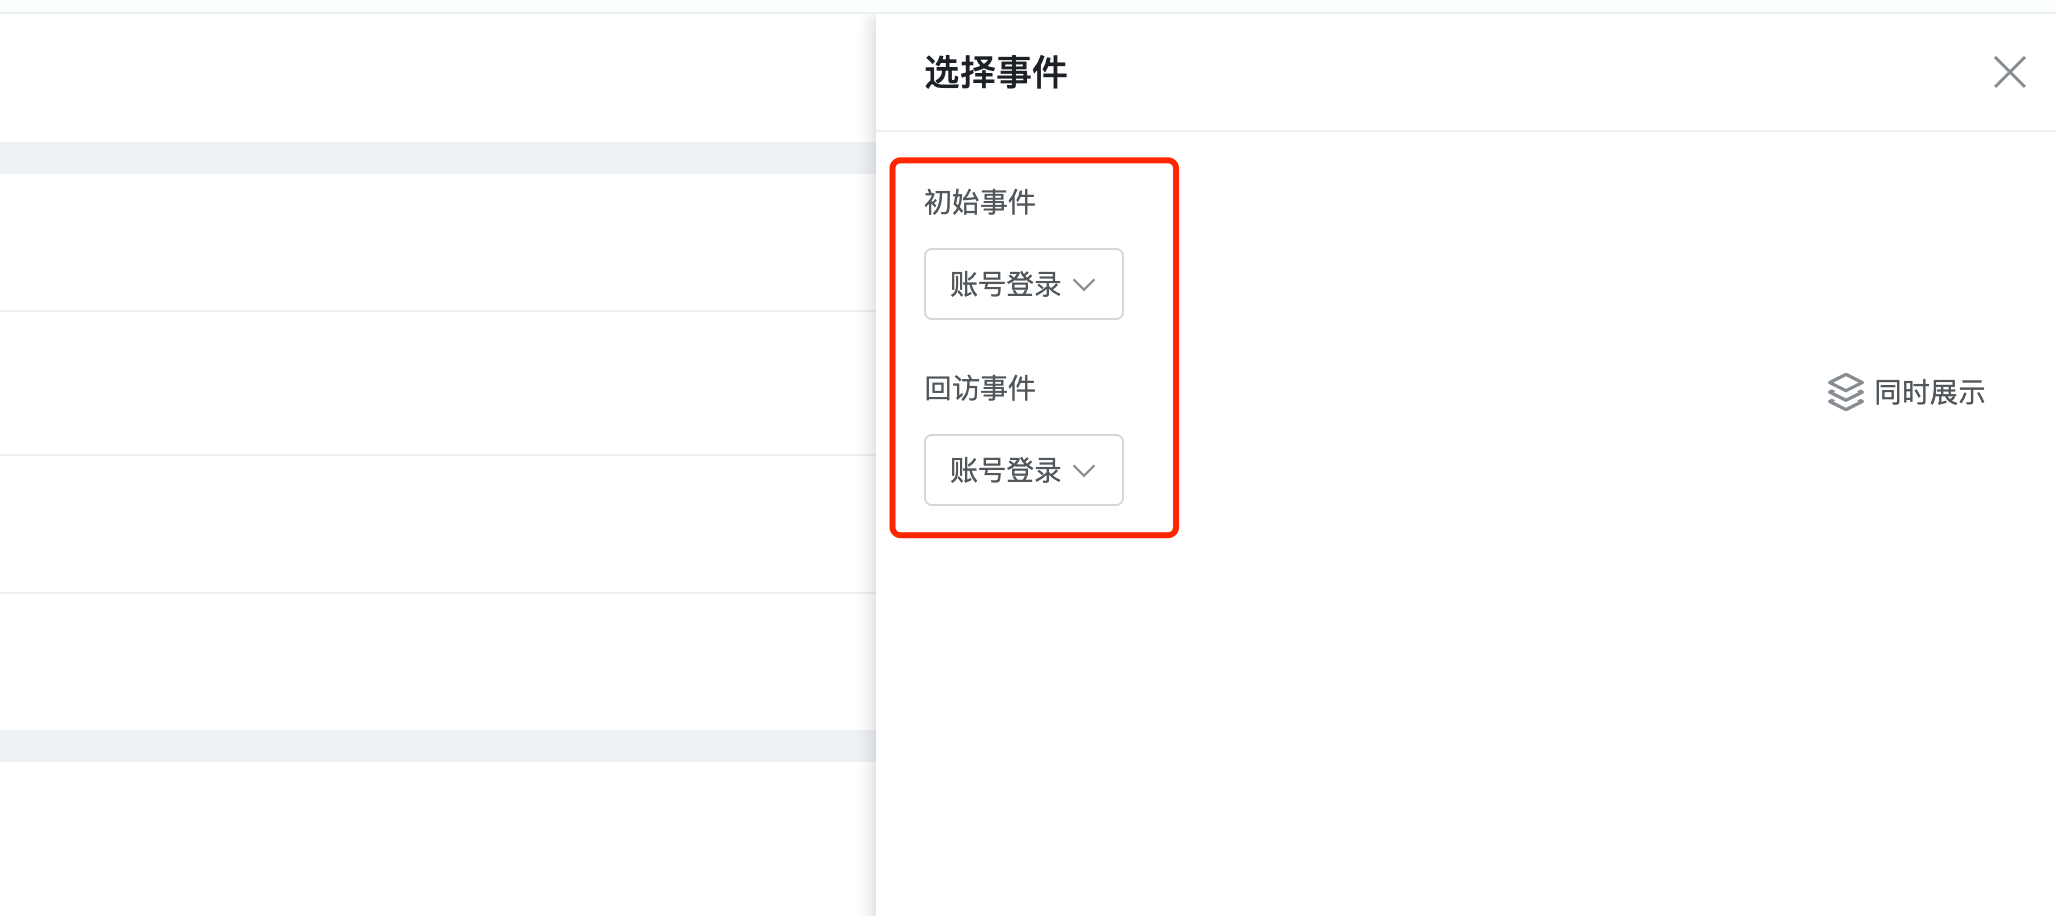
1. Setting events: Since we focus on the overall retention of users to the game, we set the initial event and return event of users as "account login".
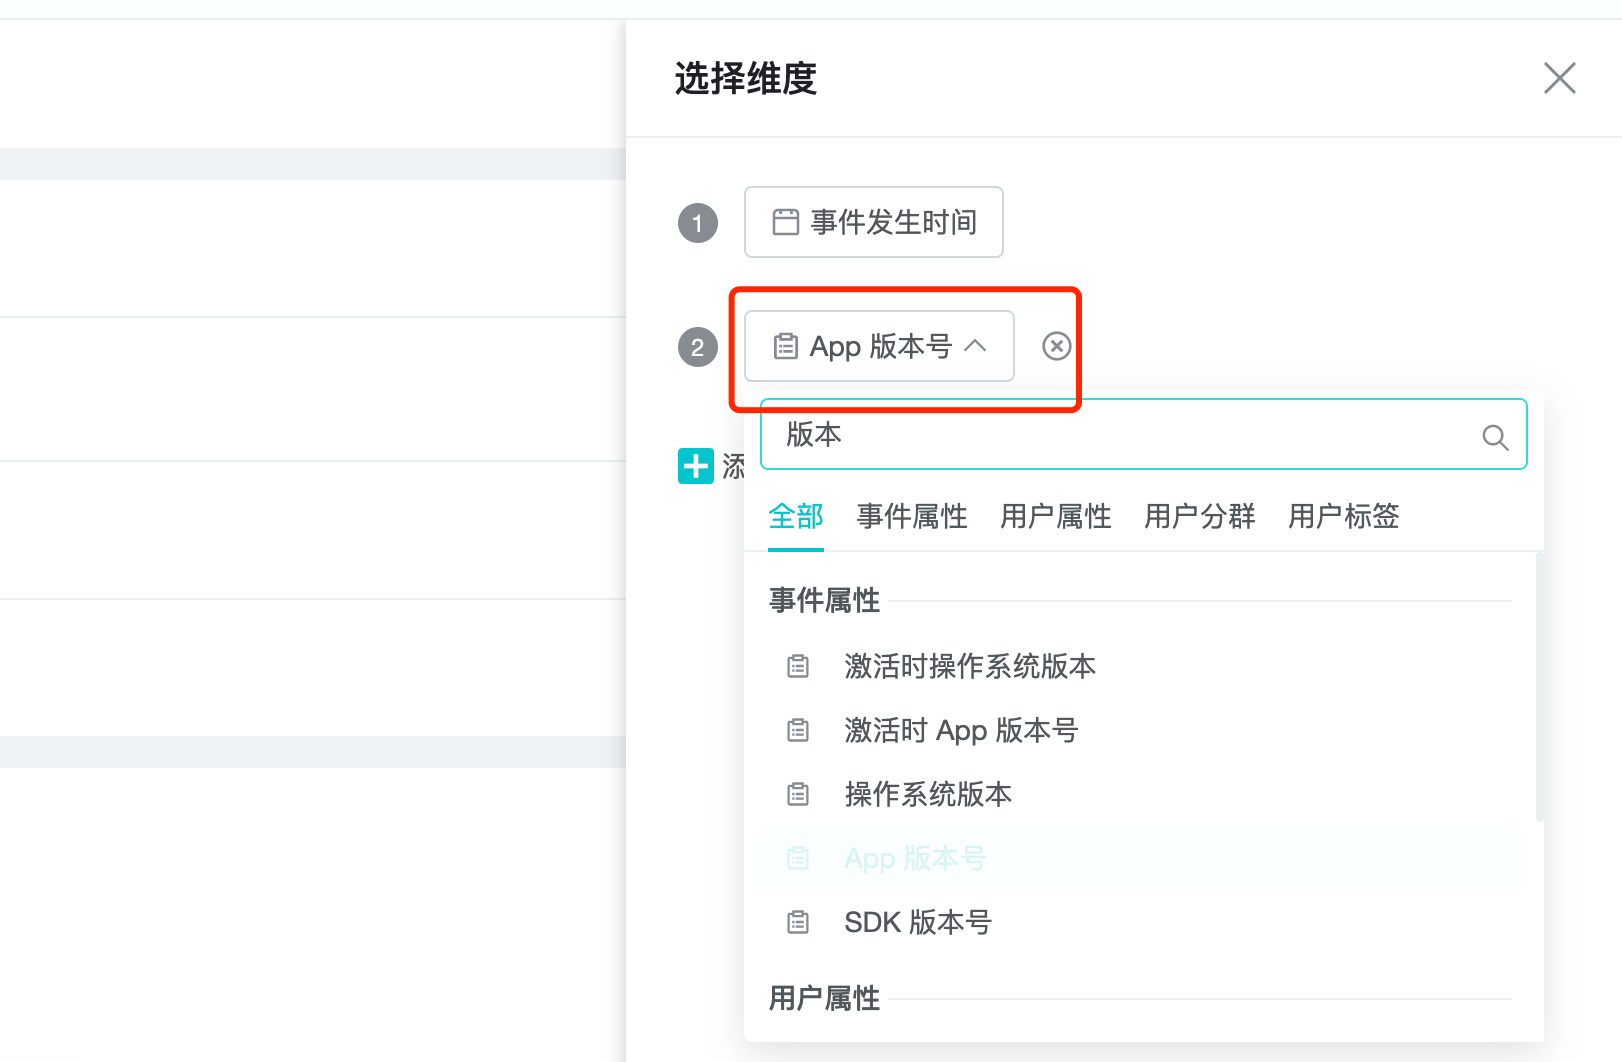
2. Set the dimension: We are concerned about whether version updates have an impact on retention, so select "App version number" in the dimension.
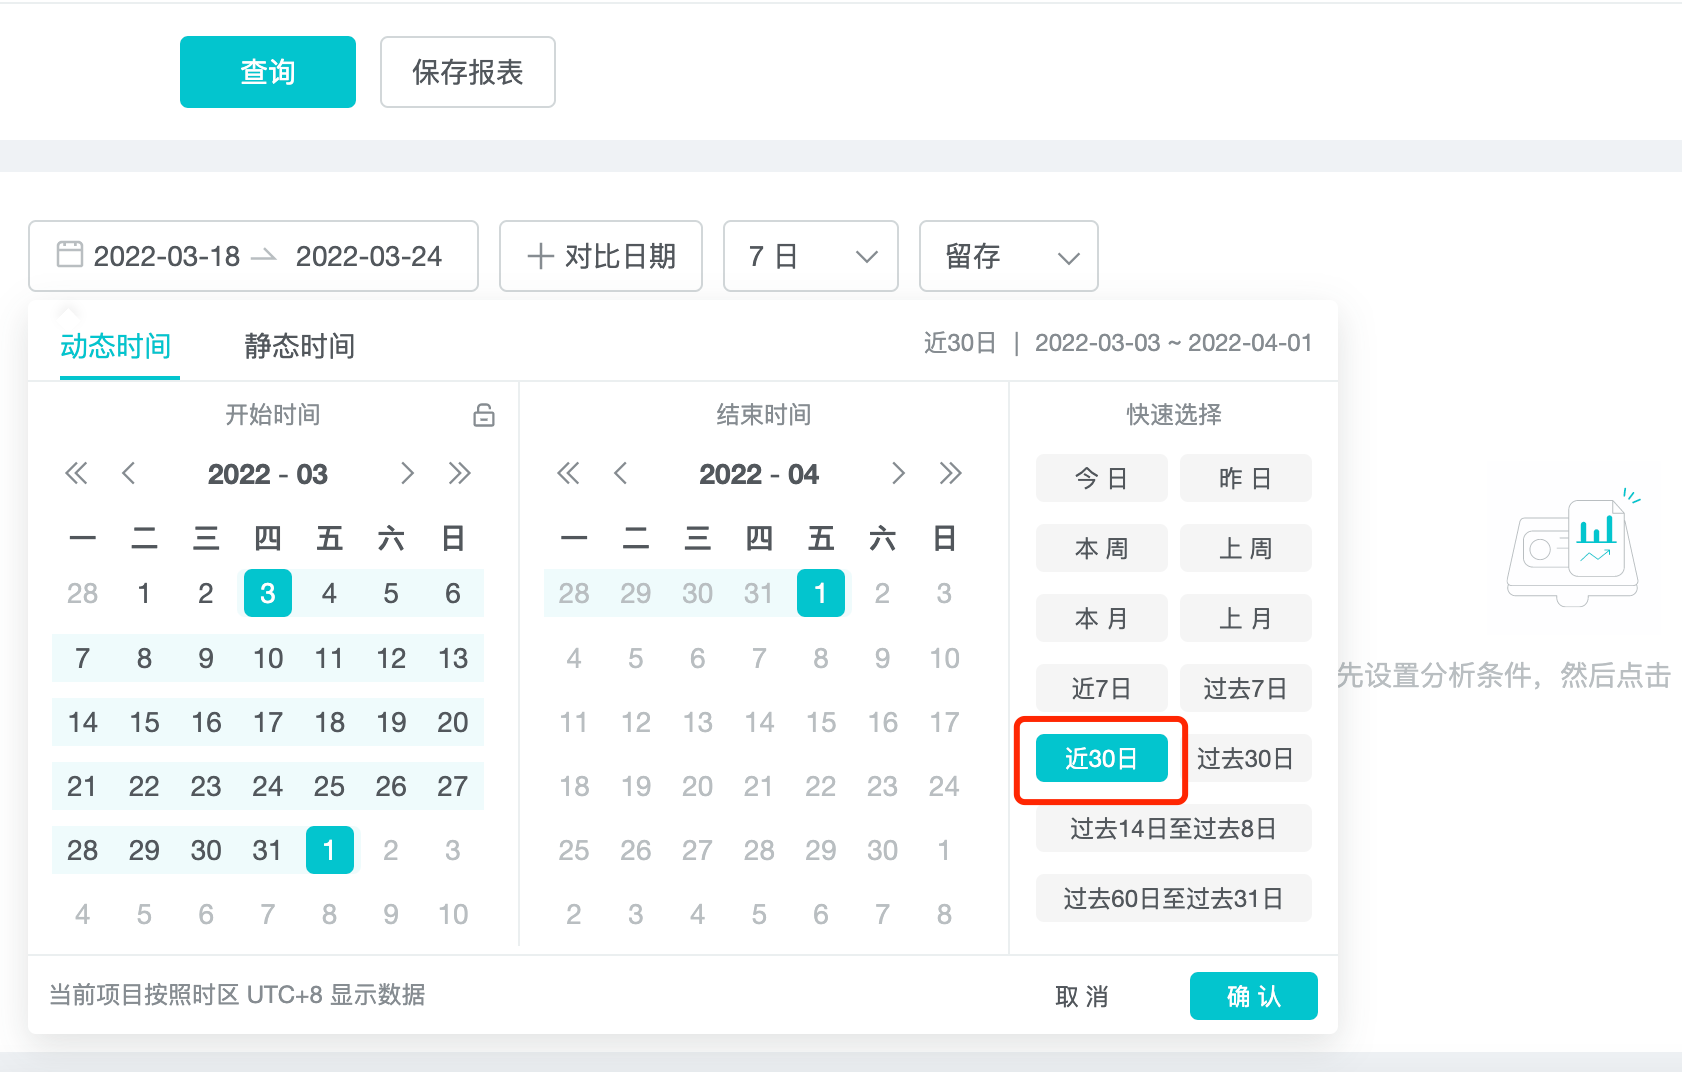
3. Set display results: setting up time intervals and other parameters.
4. Save Report: View the analysis results and save the analysis results as a report.

2. What Is Retention Analysis
Retention is when players stay in your game and keep using it.
Only with good retention can you guarantee that new players will not be lost after registration. Sometimes we only look at the daily activity (DAU), we will think the data is good, but it may be because of the recent intensive operation to attract new users. but the remaining users are not necessarily growing, it may be decreasing, it is just hidden by the number of new users. This is like a basket that keeps leaking, and it is difficult to achieve sustained growth if you do not repair the cracks under it and only pour water into it.
When we talk about retention, we mean the percentage of "target players" who "come back to complete an action" over a period of time. Common indicators are next-day retention, seven-day retention, next-week retention, and so on. For example, the "next-day retention rate" of a "new player" acquired at a given time is often used to measure the effect of attracting new players.
3. Use Cases For Retention Analysis
- The number of players who have completed the login (initial event) and have made a top-up operation in the next month (return event).
- How many players who upgraded to VIP level 9 (initial event) purchased gift packs in the coming month (return event).
- To determine whether a game update is working or not. For example, observe whether someone uses the game for a few more months because of the new hero character.
4. How To Do Retention Analysis
There are 4 steps in the retention analysis.
1. Setting events
2. Set the dimension
3. Set display results
4. Save Report
4.1 Setting events
4.1.1 Setting initial and return events
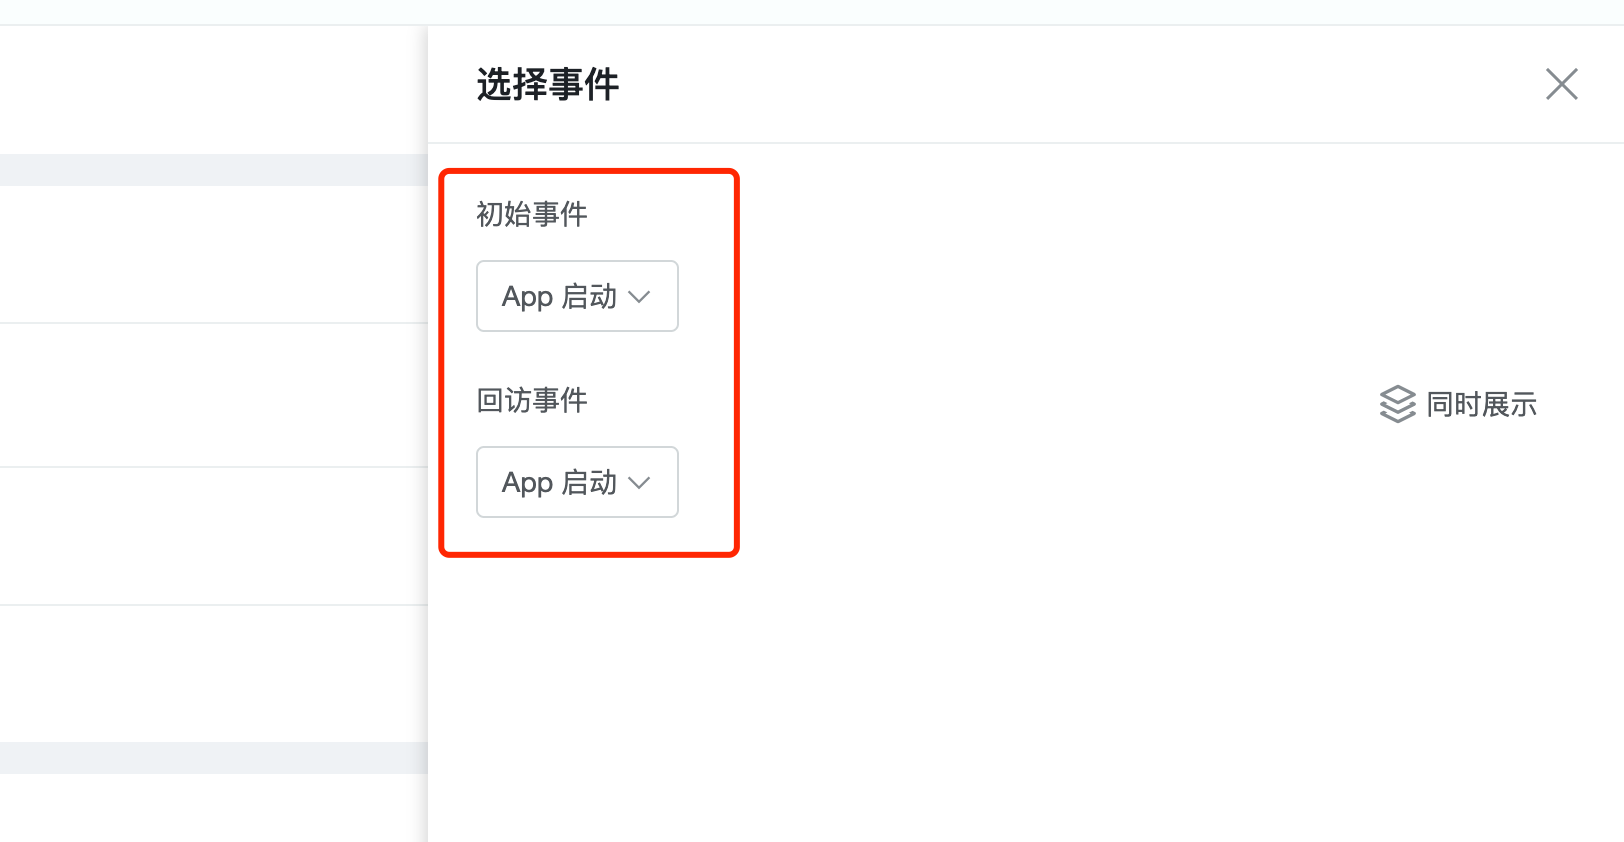
On the funnel page, click "Select Events" to screen initial events and return events. Note that only event properties are selected. If you want to select user properties, you can do so in a global screening.
4.1.2 Set "Display at the same time"
The purpose of this feature is to perform an in-depth analysis of the user who triggered the return visit event. For example, you want to count the number of users who completed the login, how many of them completed the payment, and the total amount of the users who completed the payment.
In the following screenshot, the "Display at the same time" function is used to calculate the cumulative sum of the payments made by the paying users.
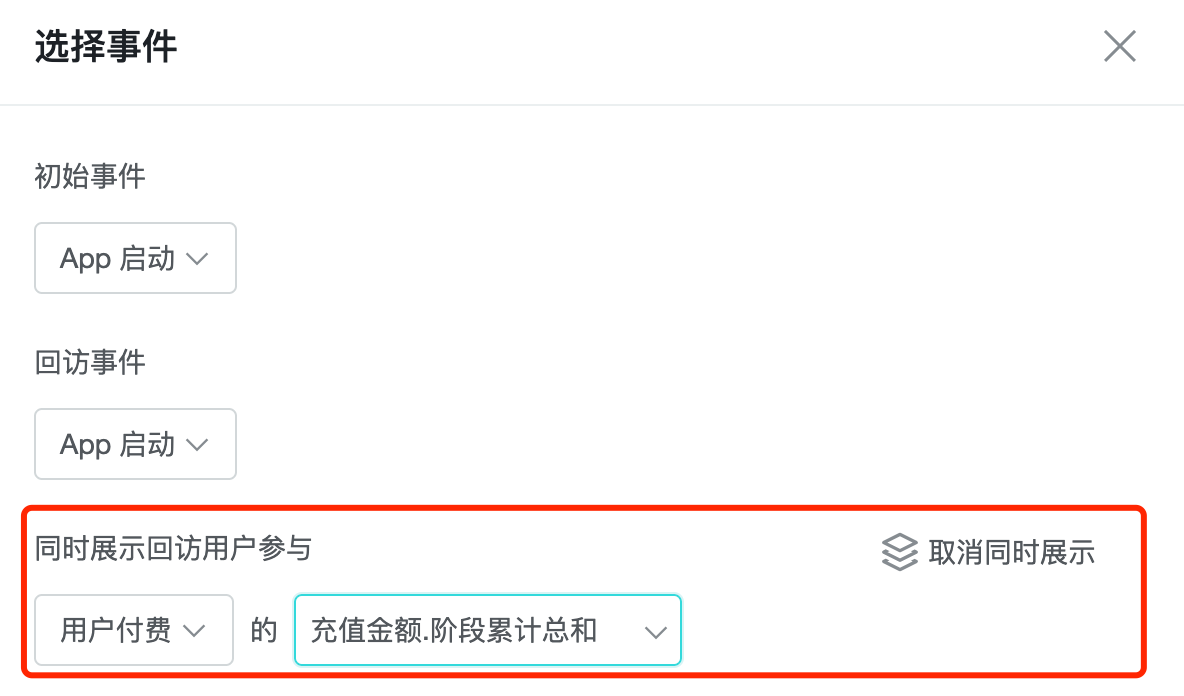
The difference from the event analysis template is that the "Display at the same time" function changes the analysis perspective from "sum, median, mean, maximum, minimum, per capita, and de-weighted" to "sum, per capita, phase statistics sum, and phase statistics per capita" for attributes of the numeric type.
And only numeric and boolean attributes can be selected, not time, string, or list attributes, because these types of attributes cannot be "Phase statistics". Using the "Display at the same time" function, we can analyze the attribute values of users who complete the return visit event in the next period of time, such as LTV, N-day payment, cumulative replica damage value, cumulative number of packages purchased per capita, and so on.
| Data Type | Analysis Perspective |
|---|---|
| Number | Sum, per capita value, phase cumulative sum, phase cumulative per capita |
| Boolean | Is true, is false, is null, is not null |
In addition to the Analysis Perspective of each value type listed in the above table, the default "Analysis Perspective" for any event and any value type are: total number of times, number of triggered users, and number of times per capita. "Phase Accumulation" is the core value of the "Simultaneous Display" function. The "Simultaneous Display" function can only do one analysis at most.
4.2 Set Dimension
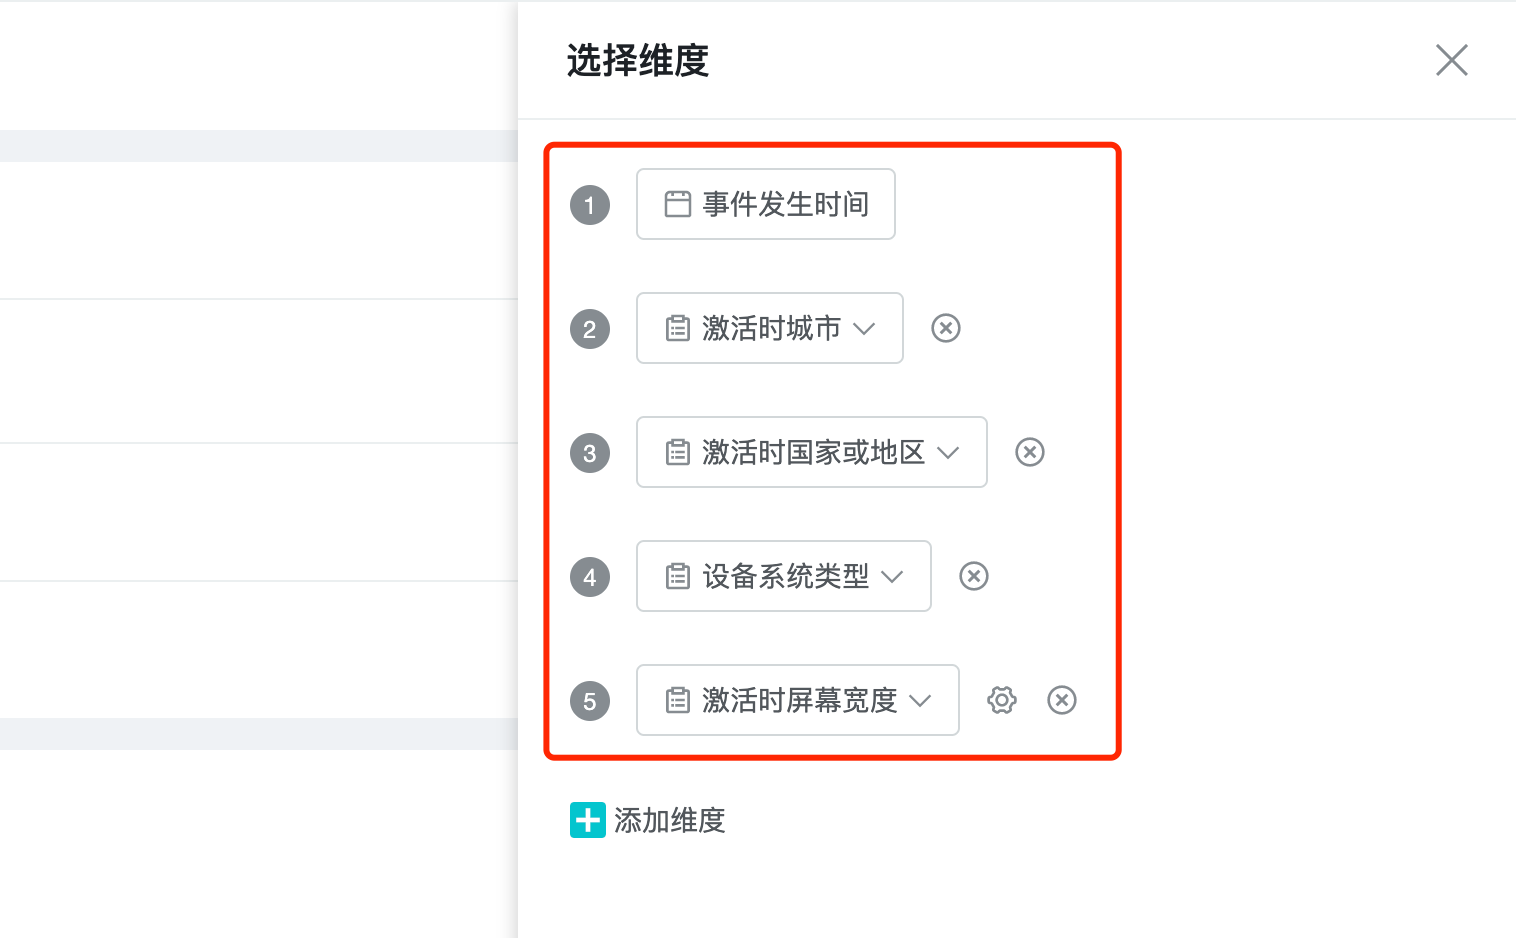
Time to event is a required dimension for retention analysis because retention is associated with time. In addition to the time dimension, you can choose up to four additional dimensions.
4.3 Set Display Results
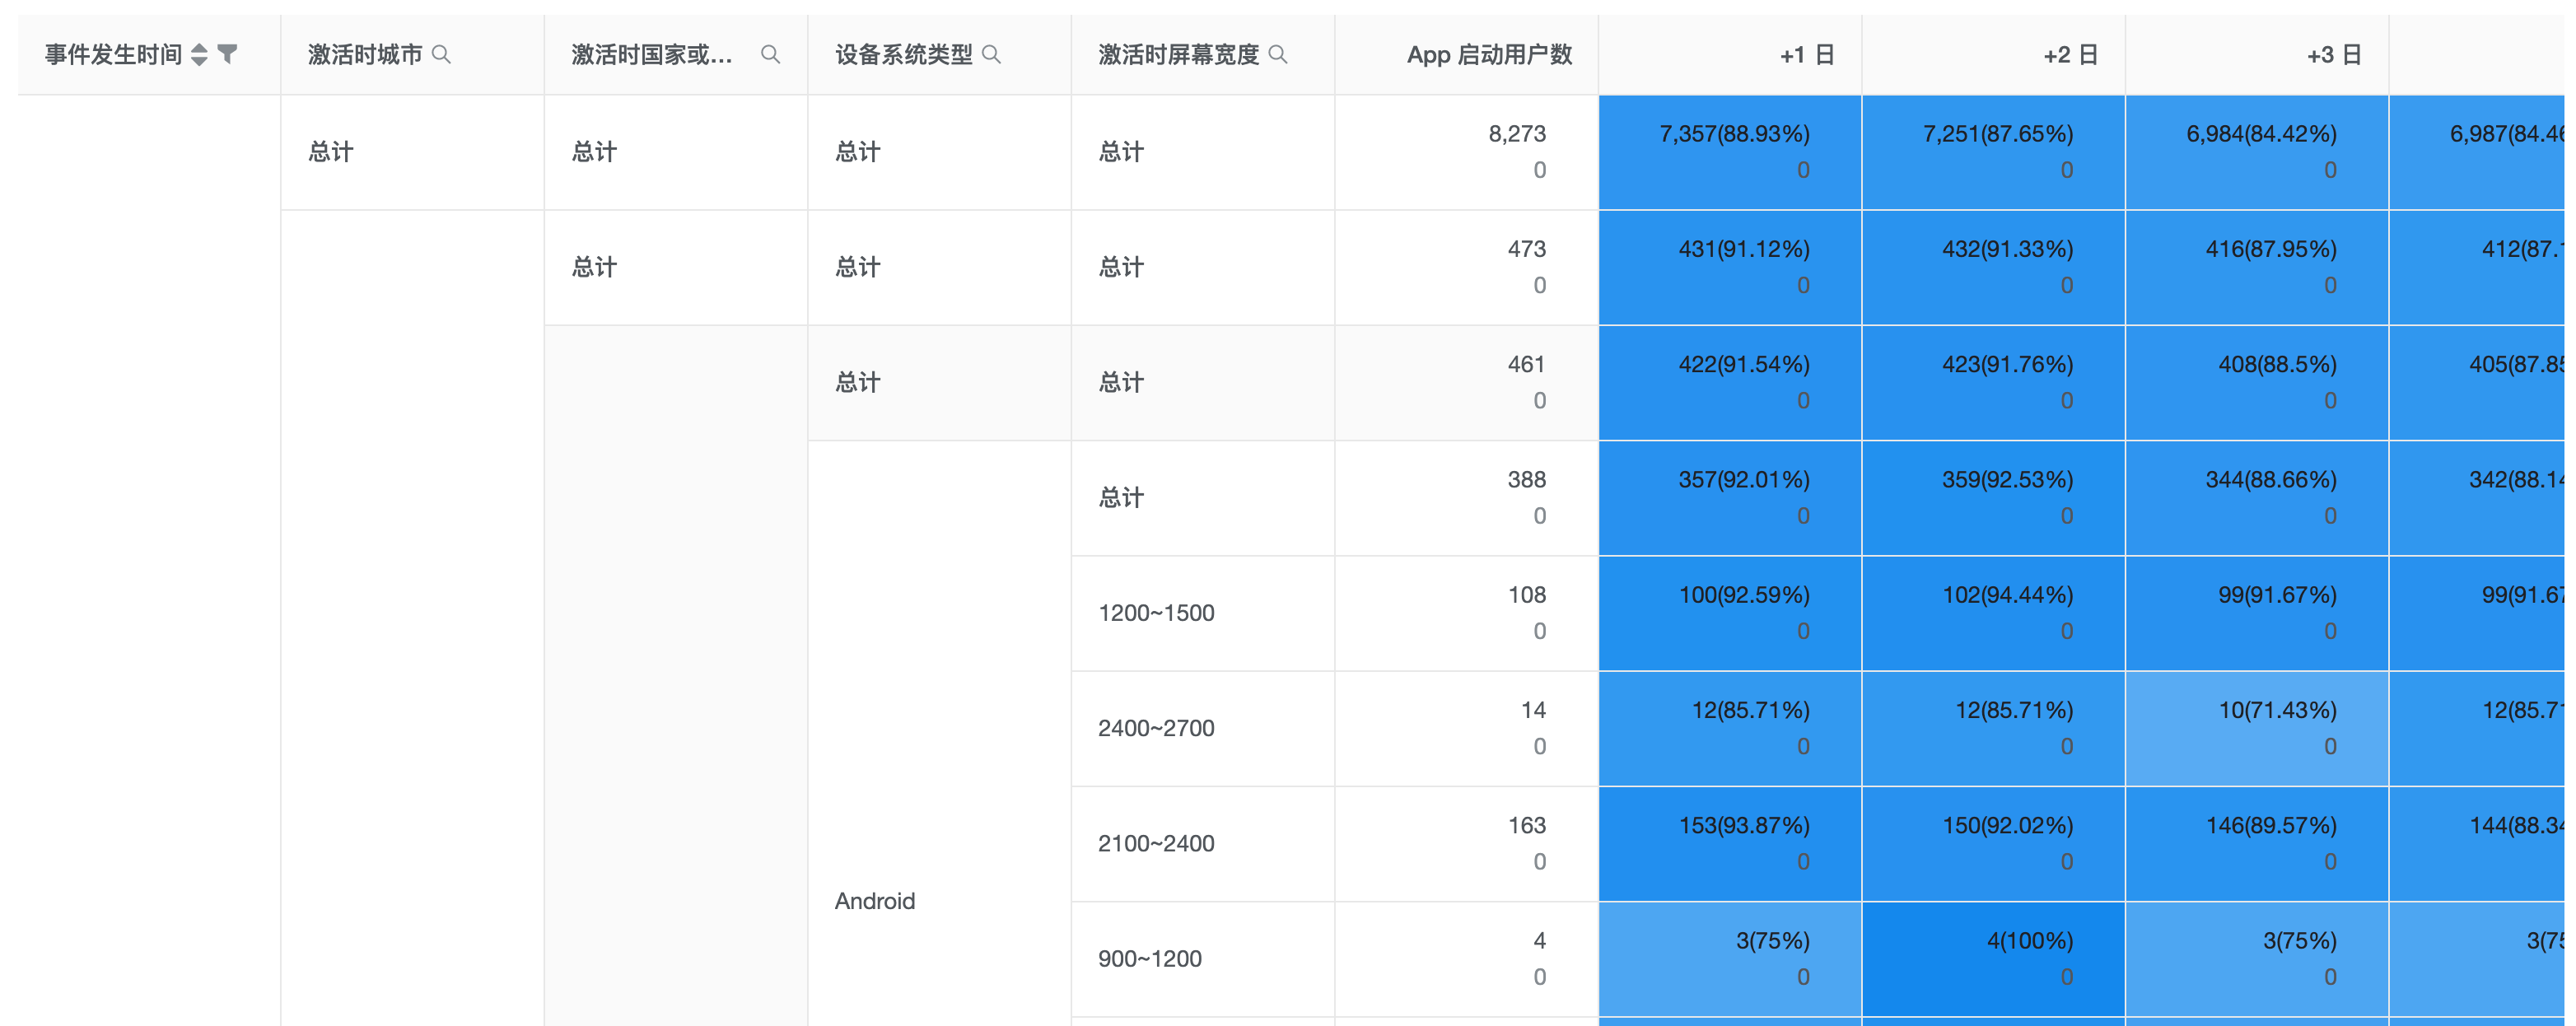
The report of retention analysis is still in the form of a pivot table. Unlike the event analysis report, the dimension of "Event Time" cannot be dragged and dropped to change the order of aggregation, and "Event Time" can only be in the first column.
4.3.1 Select the analysis period for retention
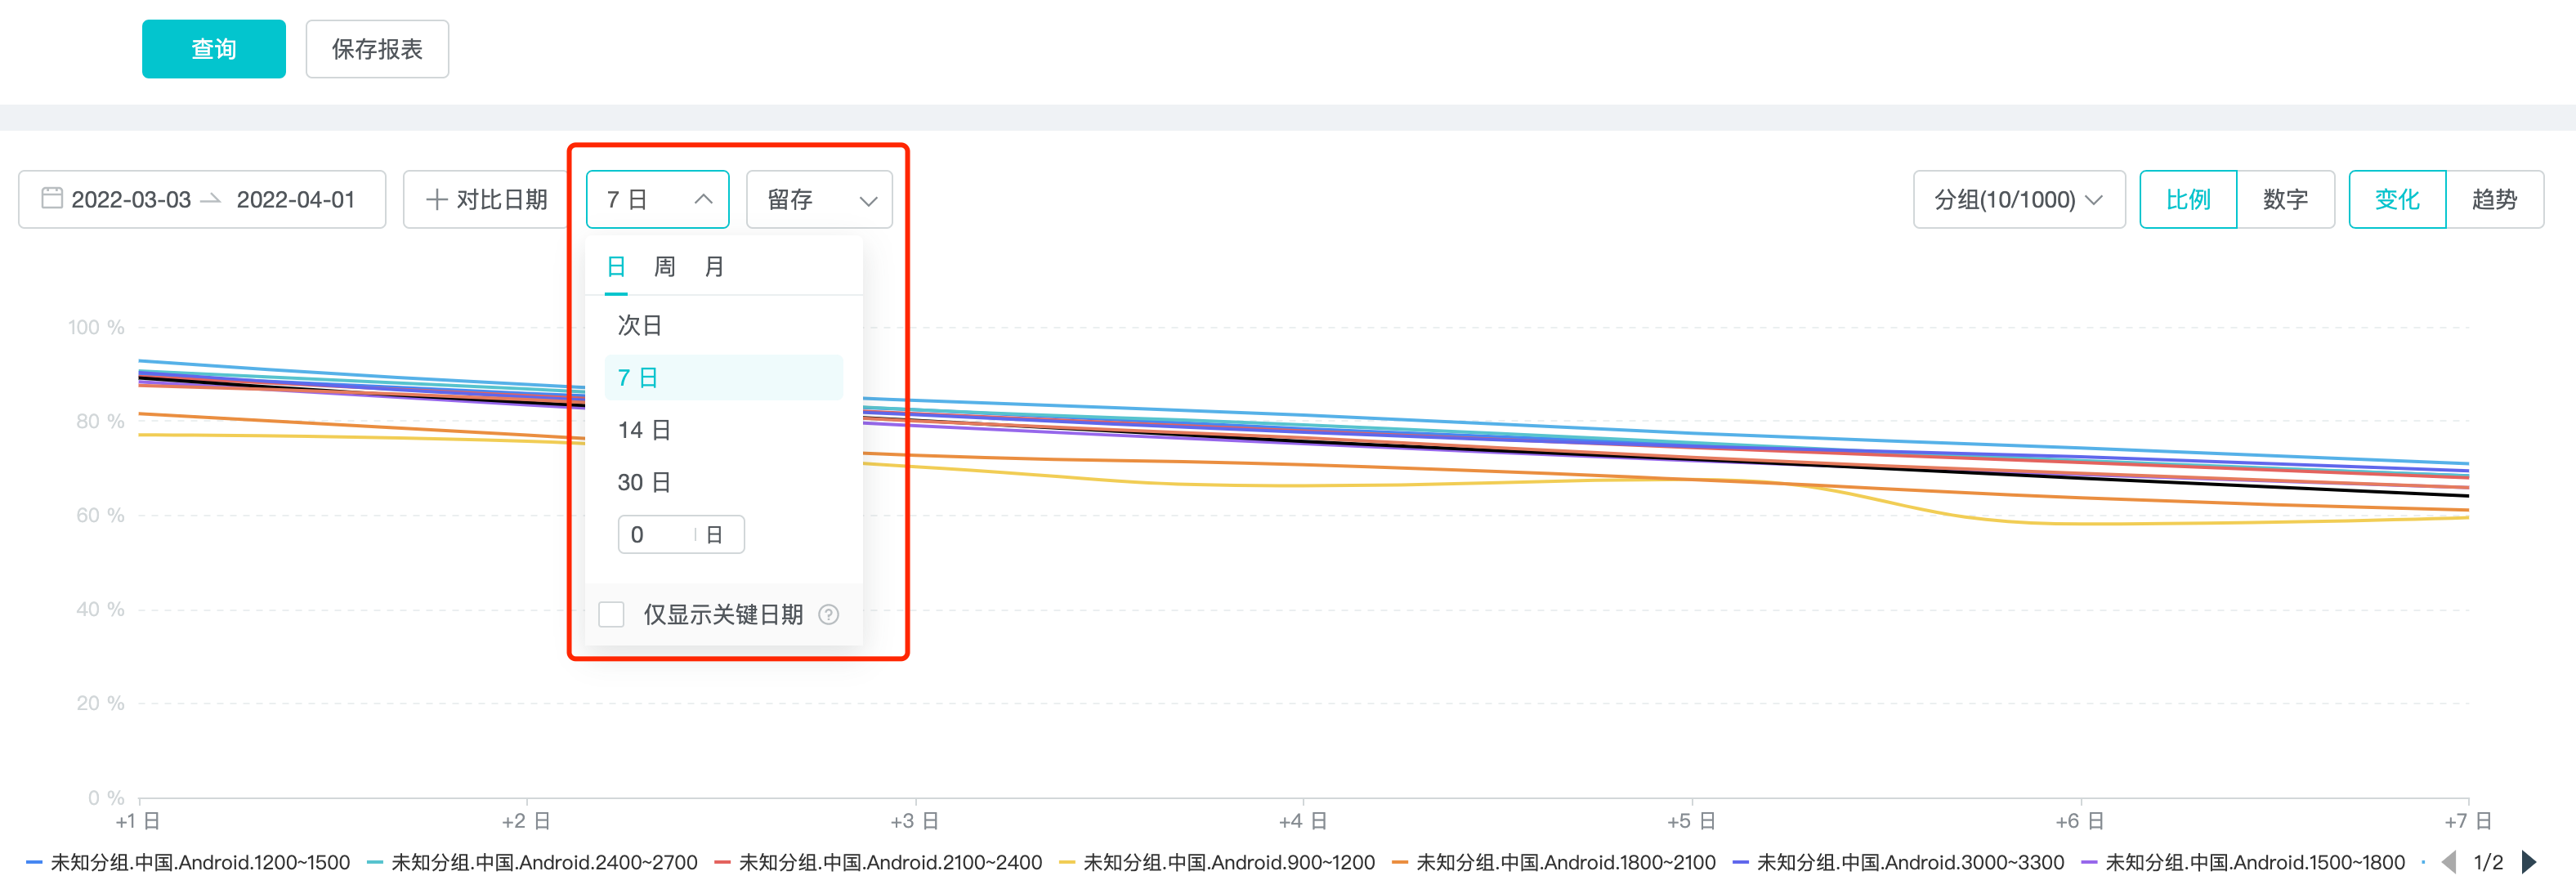
The default analysis period for retention is 7 days. Click on the drop-down box to select: current day, next day, 7 days, 14 days, 30 days, current week, next week, 4 weeks, 8 weeks, 16 weeks, current month, next month, 3 months, 6 months, 12 months.
In addition to the above time, you can also fill in n days, n weeks, n months by yourself.
If the selected analysis period is too long, for example, 180 days, the calculation will be slow due to the large amount of data, so you can use "Show key dates only".
- The key dates for days are: 1, 7, 14, 21, 30, 60, 90, 120, 150, 180, 360.
- The key dates for weeks are: 1, 4, 8, 16, 24, 32, 40, 48, 52.
- The key dates for months are: 1, 3, 6, 12, 24.
Checking "Show key dates only" will save time for searching. When the selected retention period is longer than 90 days, the system will automatically check the "Show key dates only" box.
4.3.2 Retention / Loss
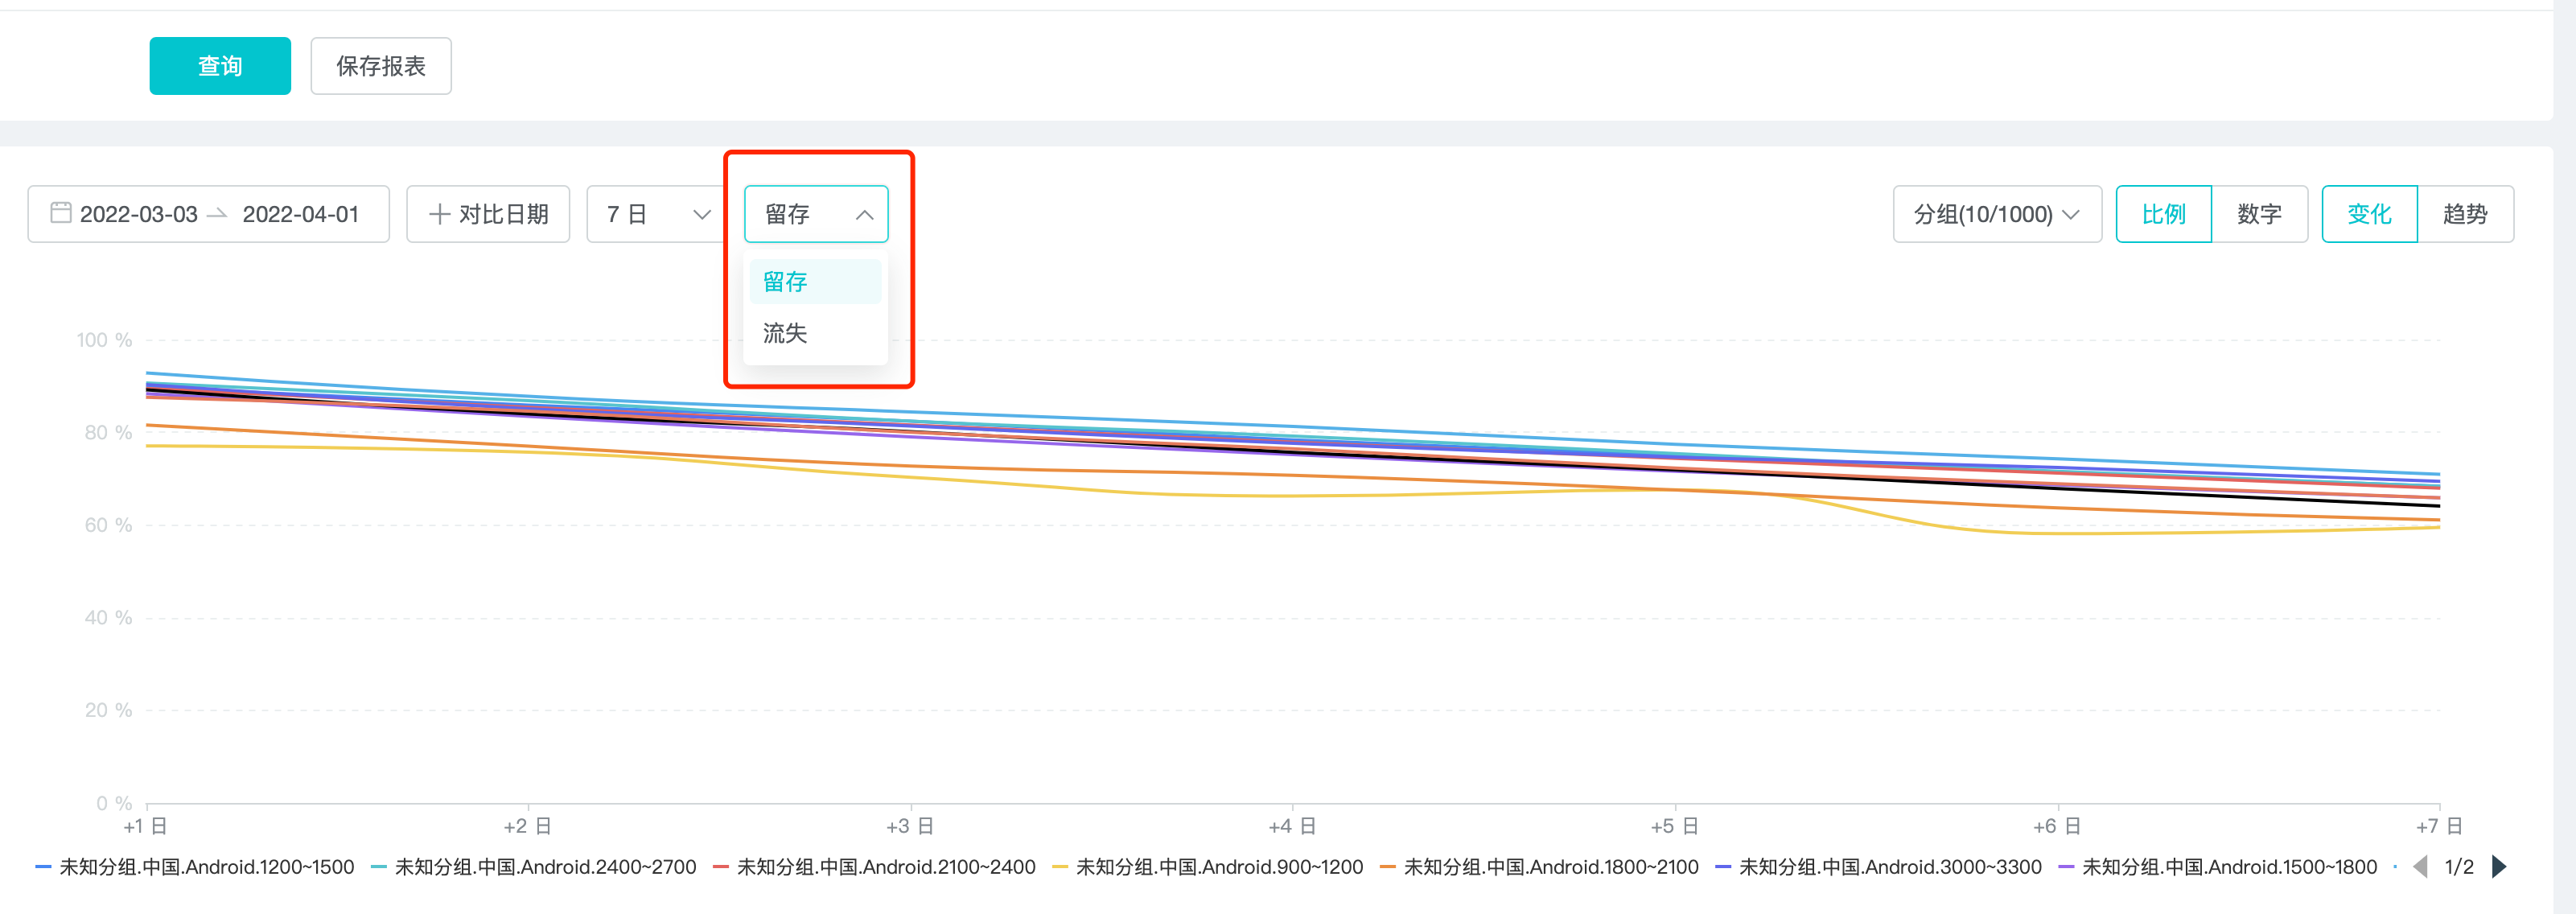
The logic of user retention on day n: If b players (assuming the number of a) who triggered the initial event trigger a return visit on day n, the "retention percentage" is b/a.
The logic of lost users on day n: If b players who triggered the initial event (assuming the number of a players) do not trigger a return event from day 1 to day n (duration), b is the number of "lost users" on day n. The "churn percentage" is b/a.
4.3.3 Display number / percentage
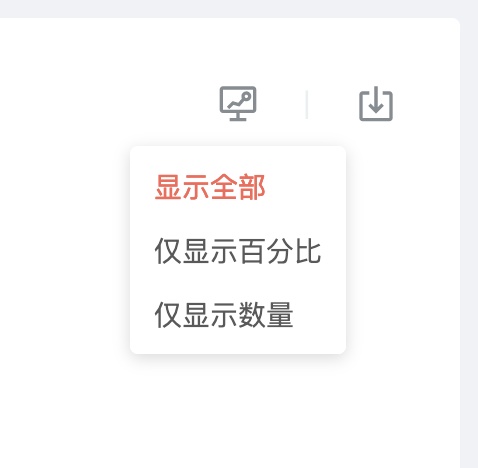
On the right side of the report, you can choose to display all / percentage only / quantity only.
4.4 Save Report
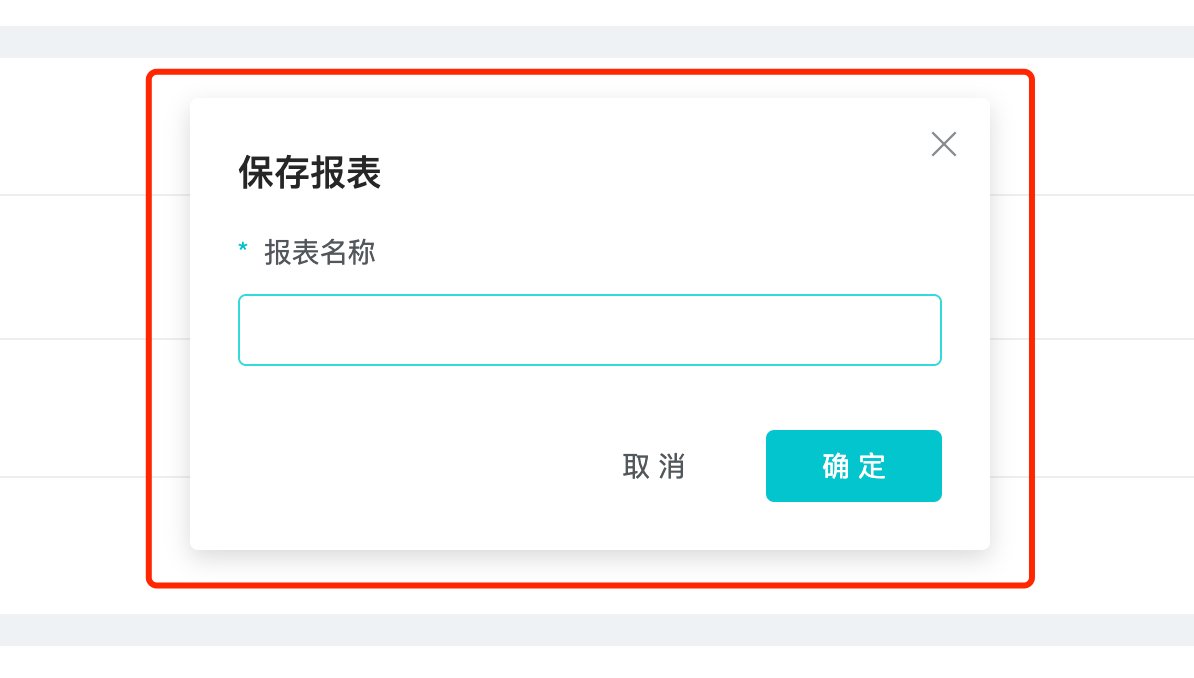
Save the query results as a report, and then create a dashboard based on the report. A dashboard makes it easy to view retention analysis results.