SQL Query
1. Overview
You can use SQL Query to query all the data in the project freely and meet the needs of personalized data retrieval and analysis.
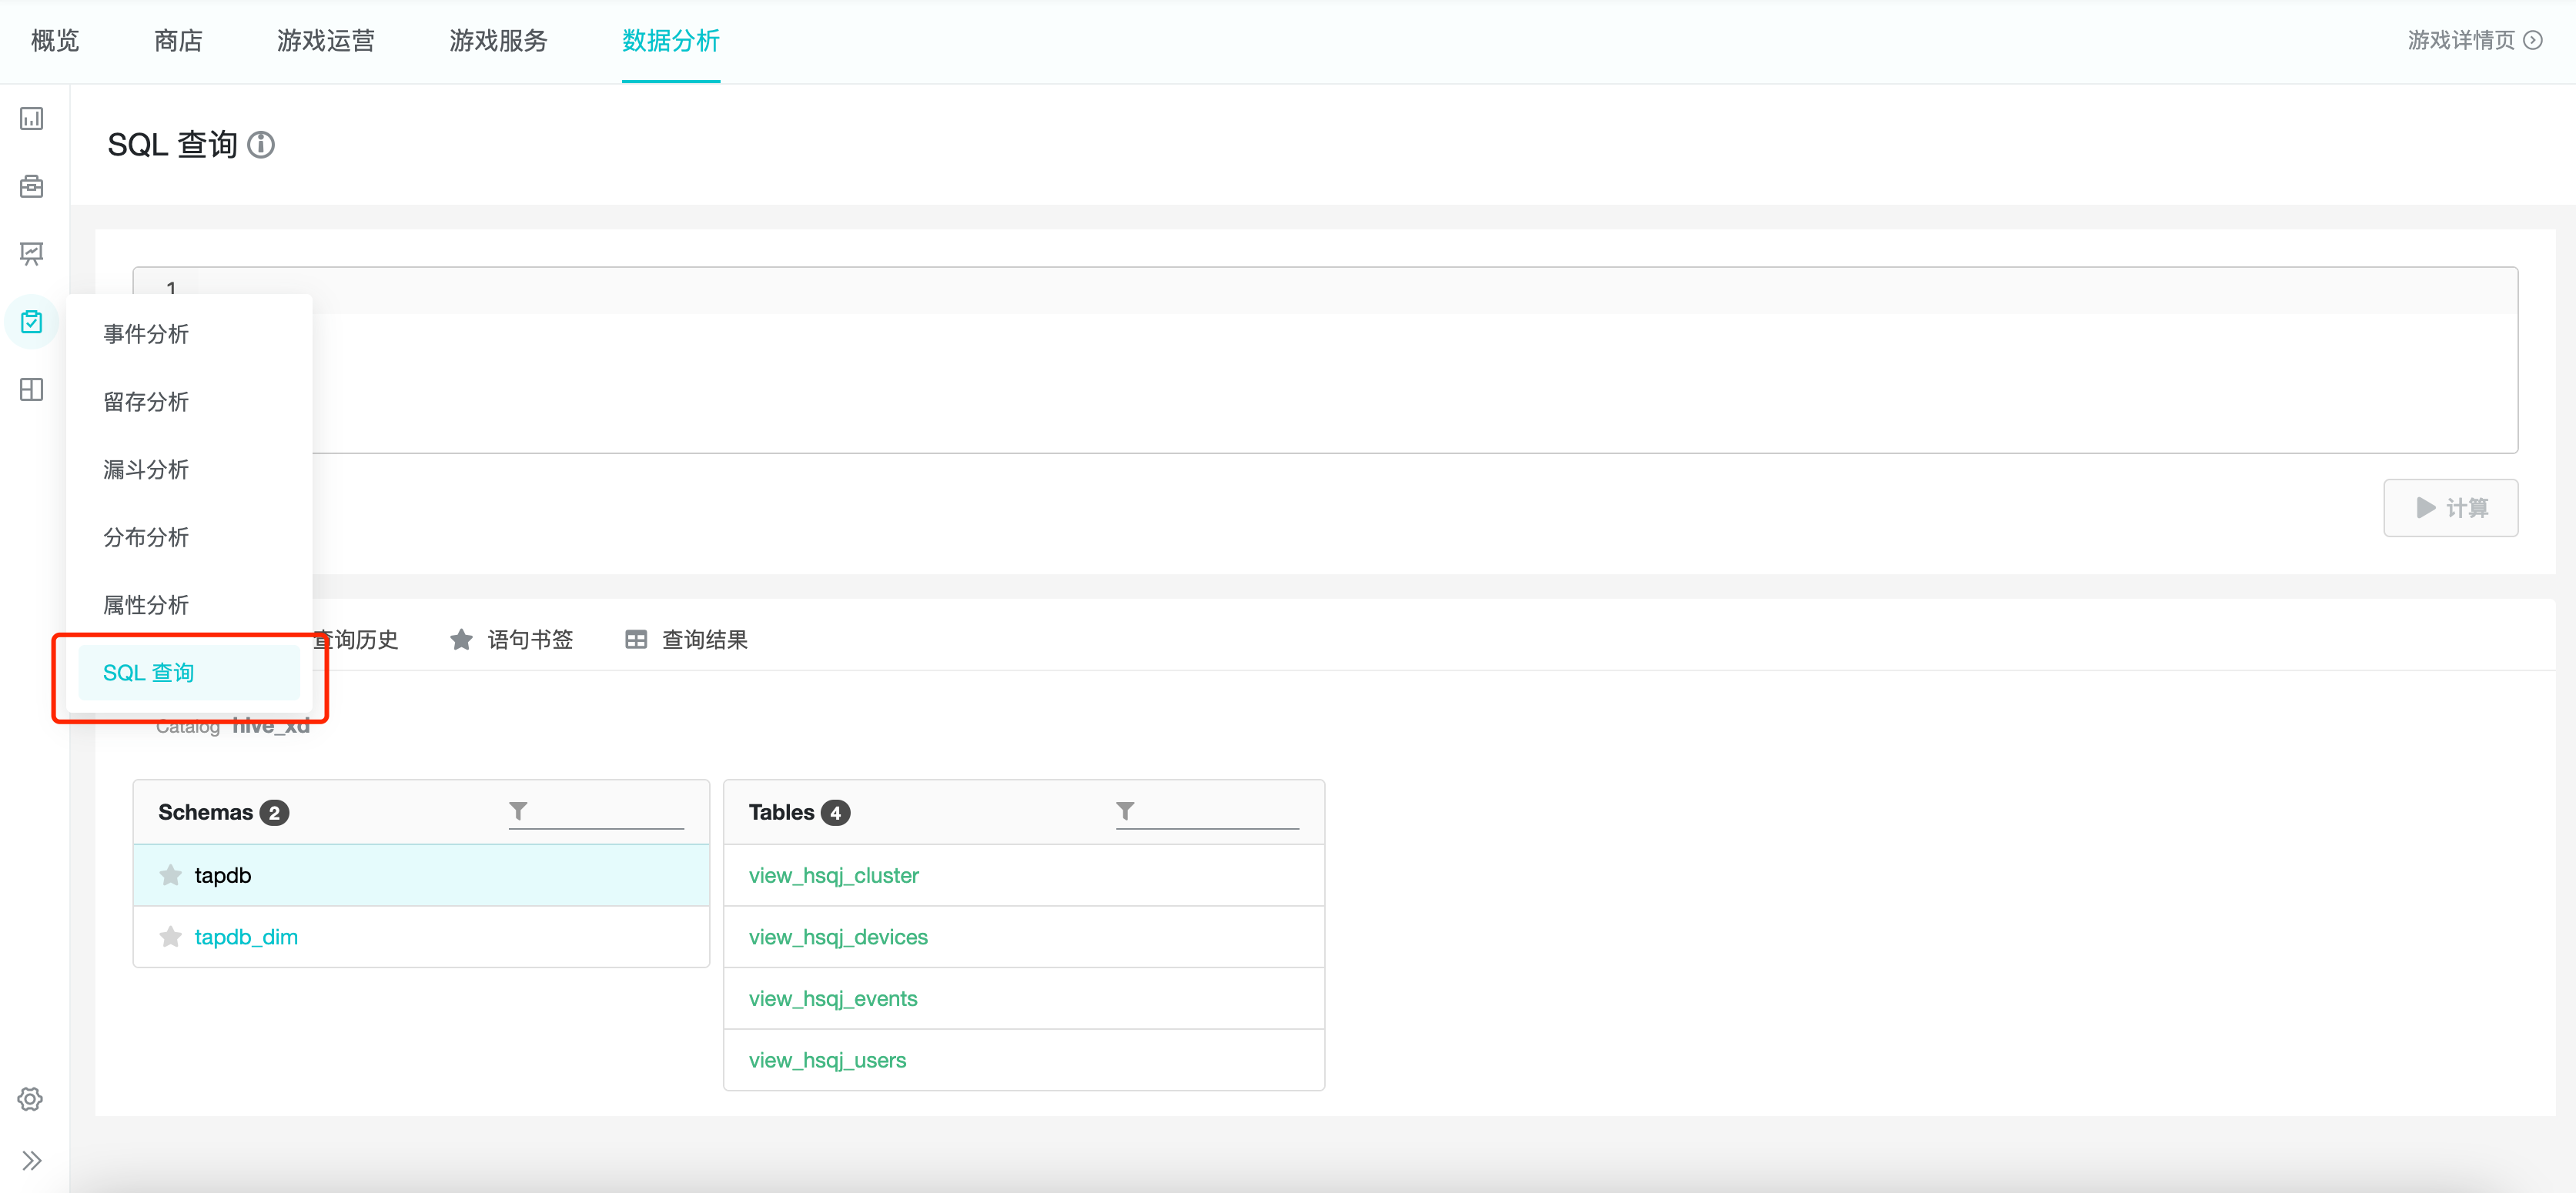
Click "Analysis" and "SQL Query" to see the SQL page, which consists of "Write Box" and "Tabs", and the tabs consist of "Table Structure", "Query History", "Statement Bookmarks" and "Query Results".

2. Applicable Roles and Uses
| Role | Usage |
|---|---|
| Administrator / Analyst | Understand the project's current data assets. |
| Analyst | Freely write SQL queries for all project data to meet individualized fetching and analysis needs that cannot be met in TapDB's inherent analysis model. |
| Business | Replace dynamic parameters in analyst SQL code to meet ongoing fetching and analysis needs. |
3. Table Scope and Notes
3.1 Table Scope
In the TapDB SQL query function, the range of library tables can be queried as follows.
| Table Type | Library Name | Table Name |
|---|---|---|
| Events table | tapdb | view_{{Project ID}}_events |
| Devices table | tapdb | view_{{Project ID}}_devices |
| Users table | tapdb | view_{{Project ID}}_users |
| User clusters table | tapdb | view_{{Project ID}}_cluster |
| Dimension attributes table | tapdb_dim | view_{{Project ID}}_{{Dimension table name}} |
It is recommended to paste the table name into the compose box by using the "Copy Table Name" function in the "Data Table List", as described in section 5.1.2 of this document.
3.2 Notes on using user cluster tables
All user cluster data is stored in the same table view_{{Project ID}}_cluster.

The user IDs under this cluster can be obtained by filtering the cluster name and selecting the phase cluster body field.
The subject of the cluster is "User":
select
    user_id
from hive.tapdb.view_{{项目 ID}}_cluster
where cluster_name = ‘{{cluster_name}}’
The subject of the cluster is "Device":
select
    device_id
from hive.tapdb.view_{{项目 ID}}_cluster
where cluster_name = ‘{{cluster_name}}’
4. Writing and Executing SQL
The SQL statements are written and executed mainly in the statement writing box.

4.1 Basic Syntax
TapDB uses the Presto query engine and applies standard SQL syntax. However, only select statements and with clauses can be used. You can access the presto documentation for the Presto syntax and how to use the functions.
Field names in the data table are recommended to be enclosed in double quotes "", or by default, but if the query field name has special symbols (e.g. $, #, etc.), then double quotes must be used.
Strings must be enclosed in single quotes ' '.
4.2 Partitioning and Time Zones
When querying the event table, you must use the partition key $part_date for conditional filtering to avoid a full table scan.
It is recommended to use the following types of partition constraints.
"$part_date" = '2021-11-01'
"$part_date" in ('2021-11-01', '2021-11-02, '2021-11-03')
"$part_date" between '2021-11-01' and '2021-11-11'
By default, the SQL query function converts and displays the fields of time type according to the East 8 zone, such as time in the event table, activation_time, last_login_time, first_charge_time, last_charge_time in the equipment table and account table.
If the project is not in Zone 8 East, it can be transformed using the time function.
format_datetime("time" at time zone 'America/Chicago', 'yyyy-MM-dd')
part_date, $part_date are dates in string format after conversion according to project time zone, if there is no need to query hour, minute and second precisely, it is recommended to use "partition" filter.
4.3 Dynamic Parameters
The dynamic parameter function can replace the parameter in the query statement, and the subsequent query can meet the new query requirements by simply entering the parameter value below the parameter input box.
The expression rule of dynamic parameter is ${parameter name}, the parameter name can include English letters, numbers and "_", it should start with English letters. Parameters with the same name are regarded as one parameter, and multiple parameter variables can be created. The input box below corresponds to the dynamic parameters in the order of the first appearance of each parameter, and parameters with the same name only correspond to one parameter input box.

4.4 Toolbar
The toolbar is located below the input box and can perform the following operations.
Formatting: formats the query statement.
Copy statement: Copy the query statement from the input box to the clipboard.
Add Bookmark: Save the query statement as a bookmark for subsequent queries or modifications.

4.5 Shortcut keys
When the cursor is in the input box, the following shortcut actions can be performed.
Ctrl + Enter: Perform calculation
Ctrl + Shift + F: Format the current query statement
Ctrl + Z: Undo the previous operation
Ctrl + Y: Resume the previous operation
4.6 Executing queries
After completing the SQL statement, you can click the "Calculate" button or the shortcut key Ctrl + Enter to launch a data query.
By default, the maximum number of data to be queried is 10000. The system will automatically add "limit 10000" to the query statement to limit the number of rows of query, and the maximum number of rows to be displayed in the front end is 500. All data can be viewed through the download function in "Query History" and "Query Results".
5. Tabs
Tabs consist of "Table Structure", "Query History", "Statement Bookmarks" and "Query Results".

5.1 Table Structure
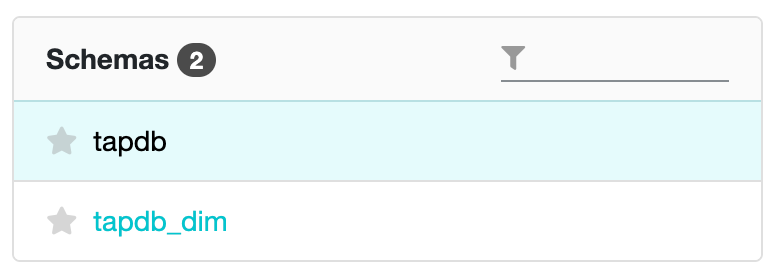
The table structure page can view the detailed information of database, data table and table field, which consists of 3 parts from left to right: database list, data table list and table field list.

5.1.1 Database list
You can view the databases under the project: click on the library name and a list of data tables under the library will be displayed on the right side.

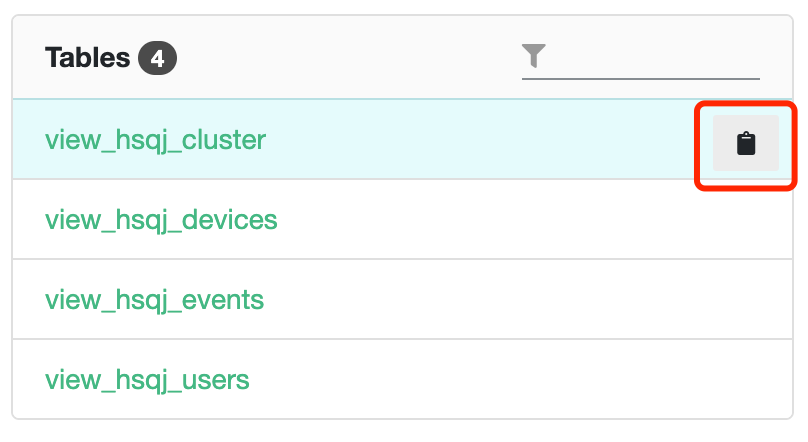
5.1.2 List of Data Tables
You can view the data tables under the selected database: click on the table name and the fields under the table will be displayed on the right side.
Click on "Copy Table Name" and the table name will be pasted to the clipboard.

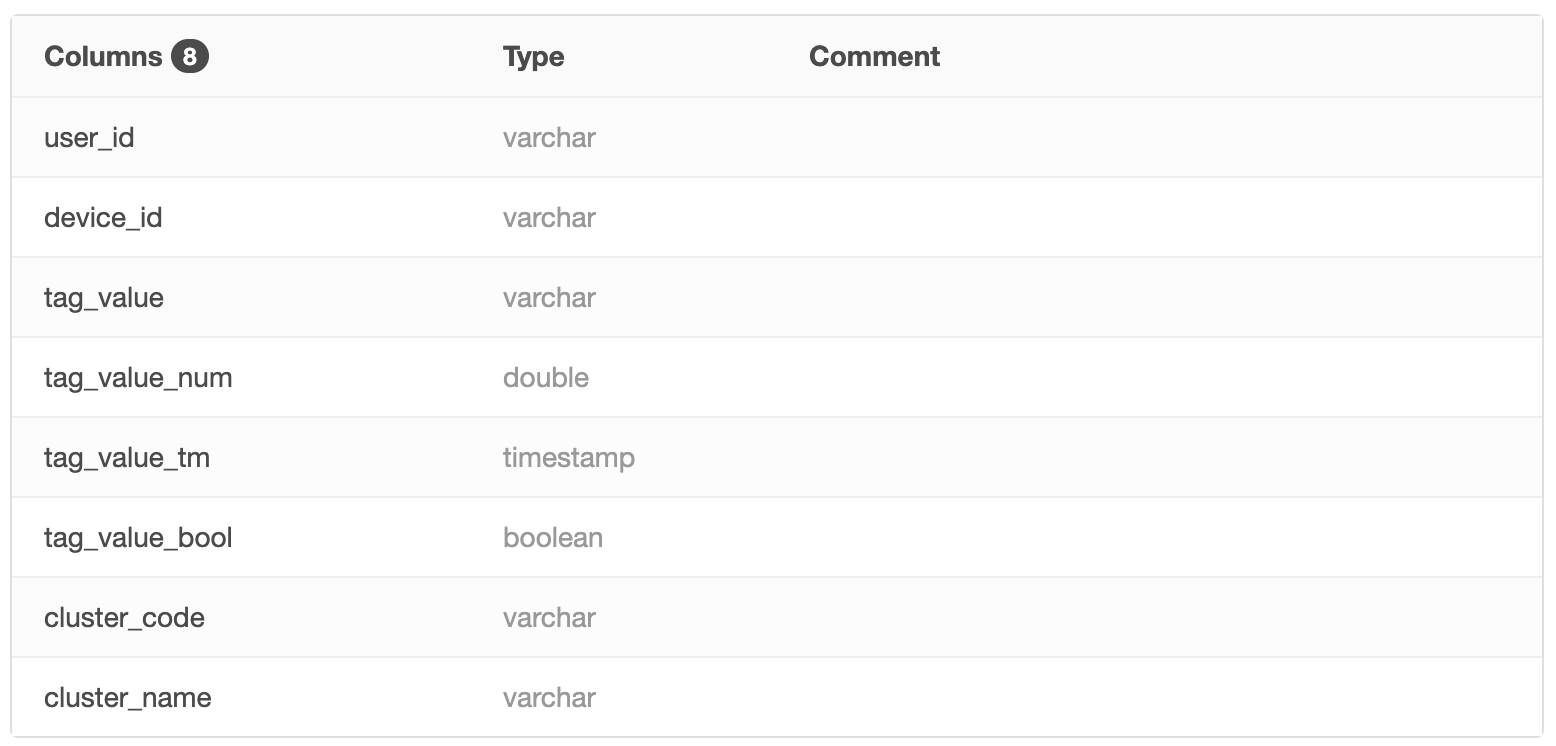
5.1.3 List of Table Fields
The table fields list allows you to view information about all fields of the selected table, including field names, data types, and explanations.

5.2 Query History
Query history page: You can view the executed query statements, including the statement completion time, calculation time, query statements and other information. It also supports searching query statements.

Click "Query ID" to jump to the query result.
Click the "Type" button in the upper right corner of the "Query Statement" to replace the statement in the input box.
Click "Download" to download the query result as a csv format file to local, the maximum number of query results displayed on the page is 500, the data exceeding the maximum number can be downloaded to local for further view and analysis, the maximum number of data downloaded is 10000.

5.3 Statement bookmarks
You can view the saved statement bookmarks in the statement bookmarks page.
Click "Set", the content in the bookmark will replace the content in the statement input box, and click "Delete" to delete the bookmark.

5.4 Query Results
You can view the history query results in the query result page.
Click "Format" to format json, map and other objects in the query results.
Click "Download" to download the query results as a csv file to the local area.
6. Best Practices
6.1 Log Export
Export the user table or event table, e.g. export all event logs for the last 7 days of users.
select
    *
from hive.tapdb.view_{{项目 ID}}_events
where "$part_date" between '2021-11-05' and '2021-11-11'
6.2 Data cleaning and extraction
Extract the key information in complex fields, such as url, json, map, e.g. extract the product ID in the last 10 digits of url.
select
    substring("#url", -10) as product_id
from hive.tapdb.view_{{项目 ID}}_events
where "$part_date" between '2021-11-05' and '2021-11-11'
6.3 Personalized Fetching and Analysis
For personalized analysis needs that cannot be met by TapDB's existing analysis models.