Funnel Analysis
1. Case Introduction
In buried design guide, we designed the buried process based on the transformation process from "user opening the app to actually creating a persona", and here we analyze this transformation process with the "funnel analysis" function.
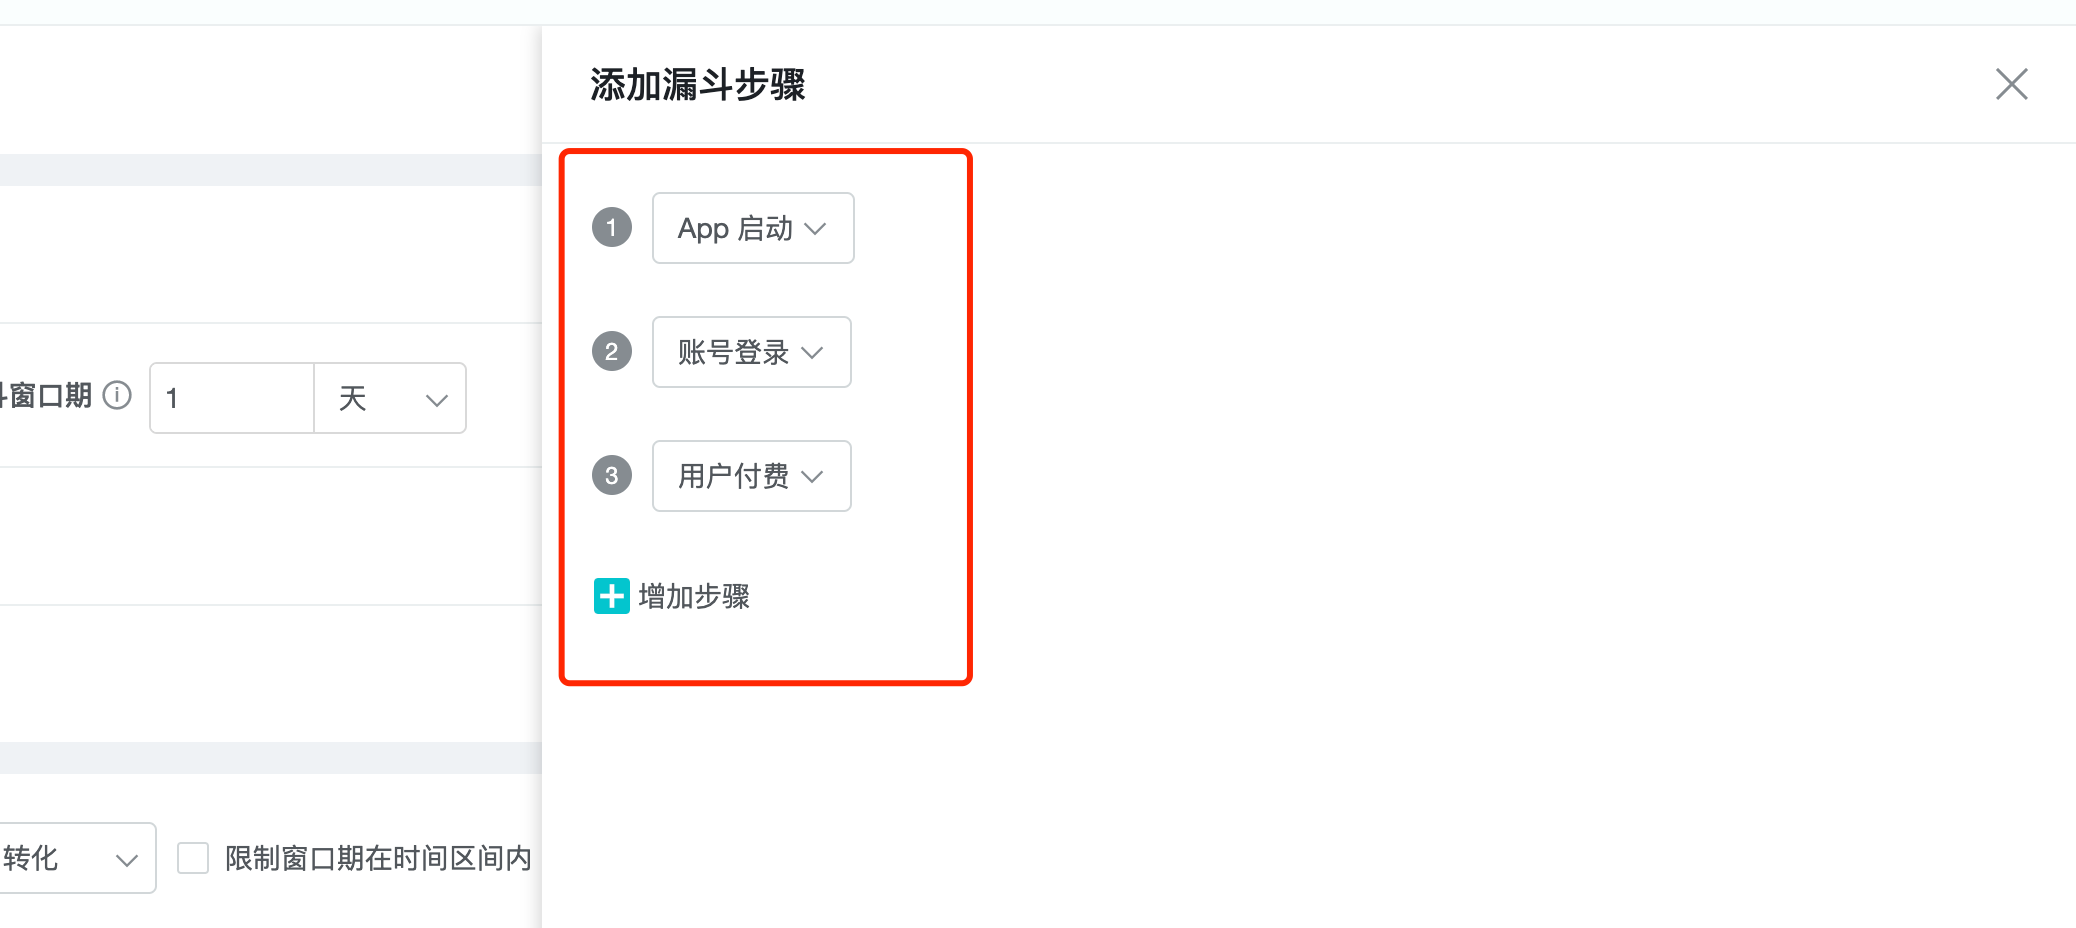
1. Set up steps: create events for the entire process from the user opening the App to the actual creation of the role, and set up funnel steps in the order of the user's actions.
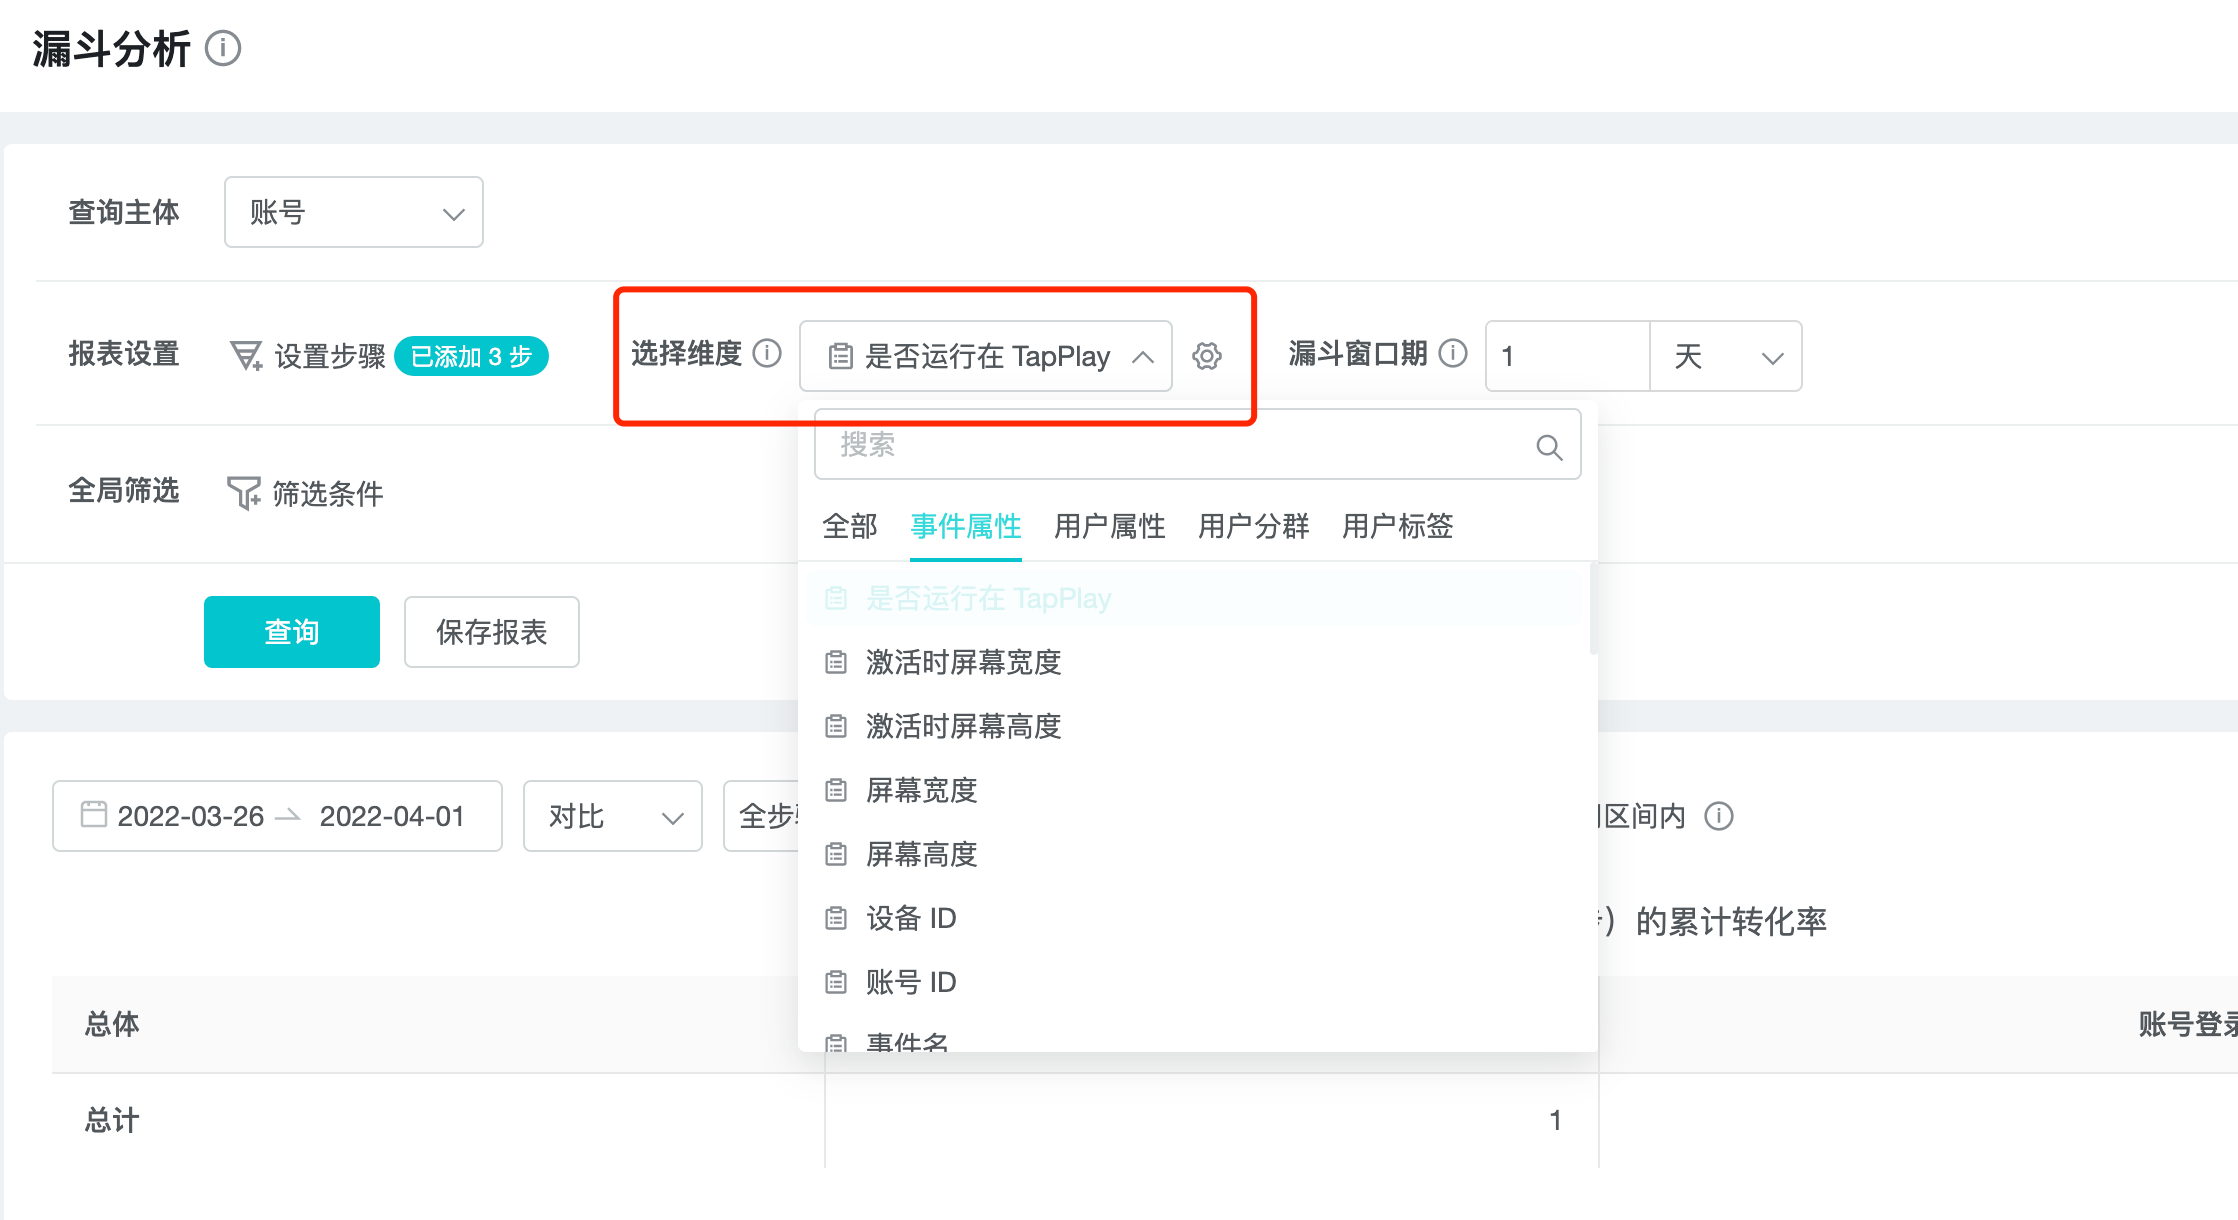
2. Setting the dimension: different system types may have an impact on the conversion situation, so select "device system type" in the dimension.
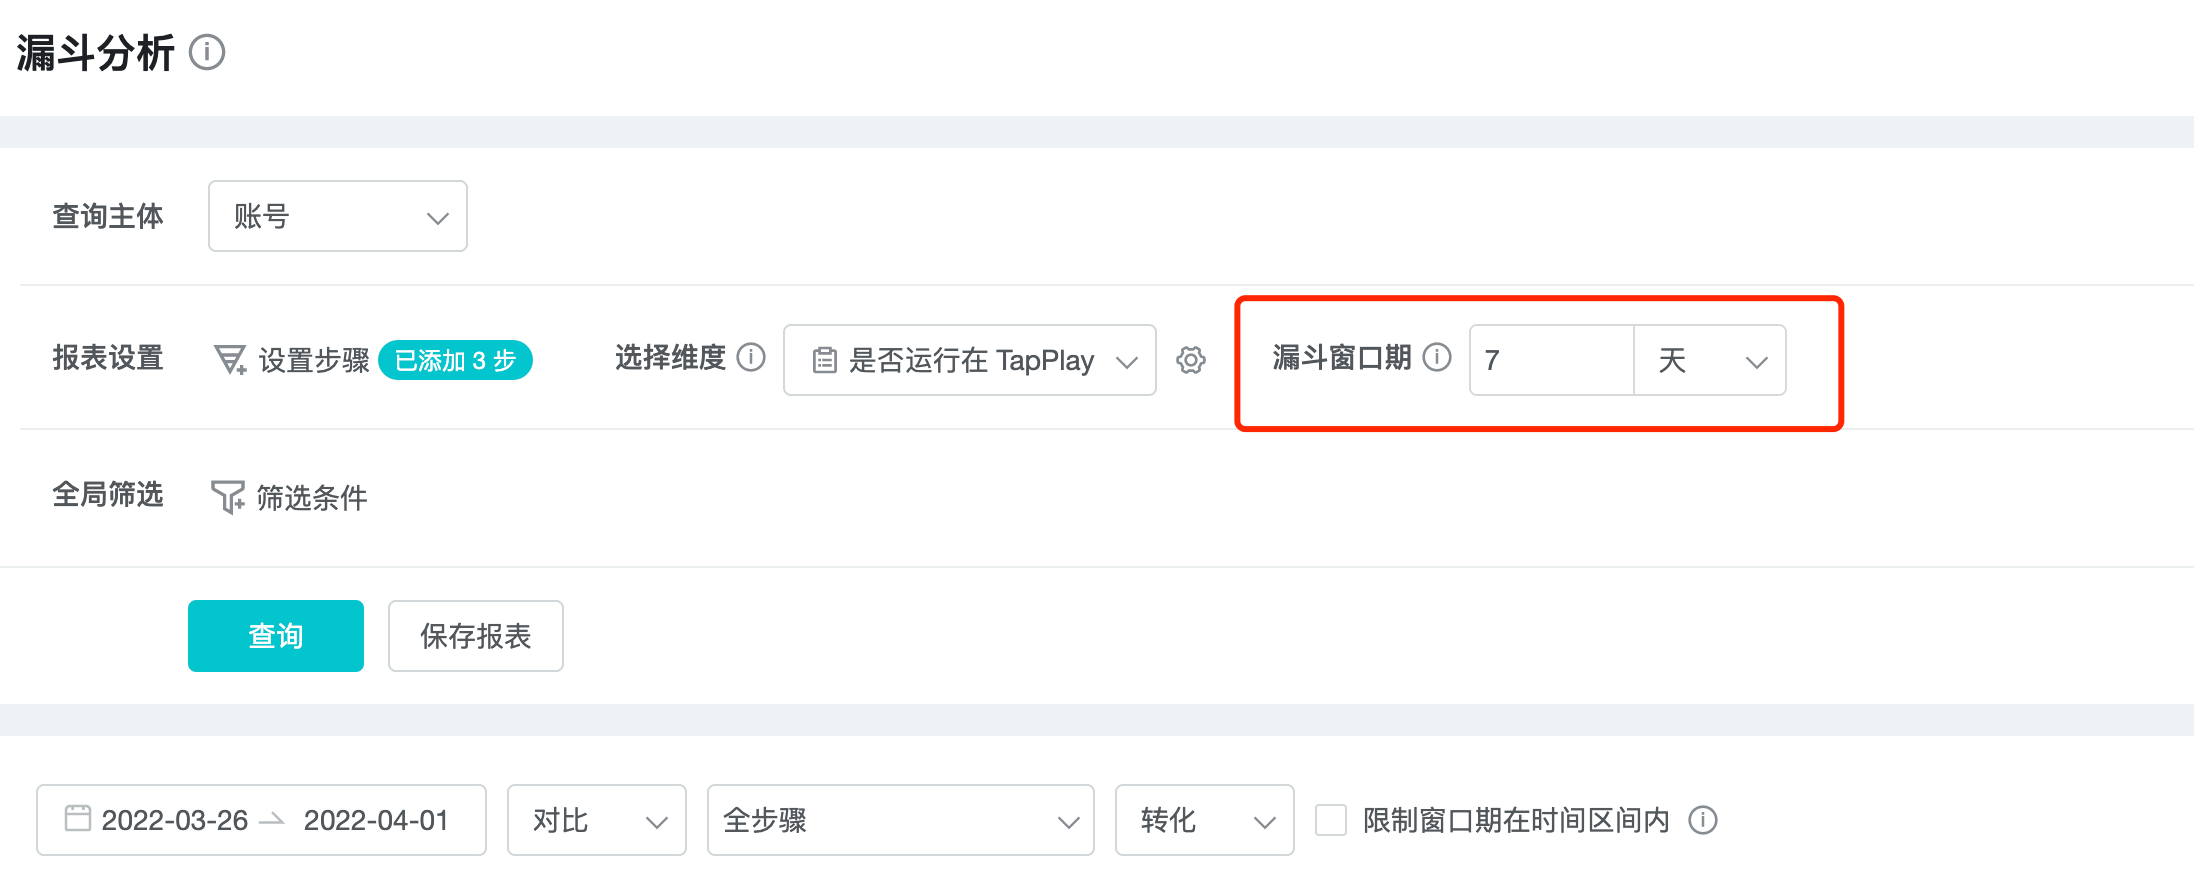
3. Setting the funnel period: we set the funnel period to 7 days.
4. Set display results: set up time periods and other parameters and click on the query to view the analysis results.

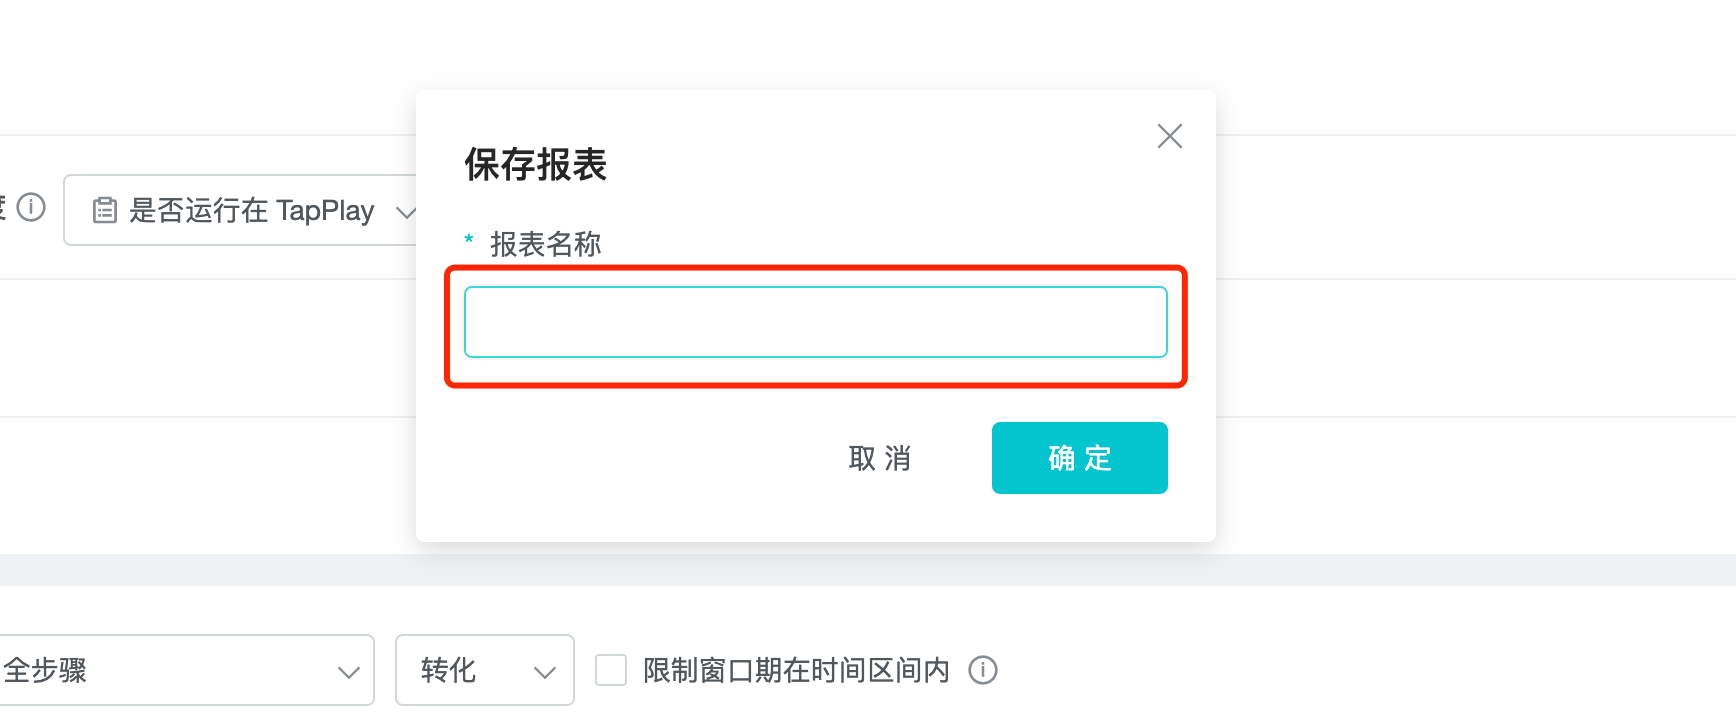
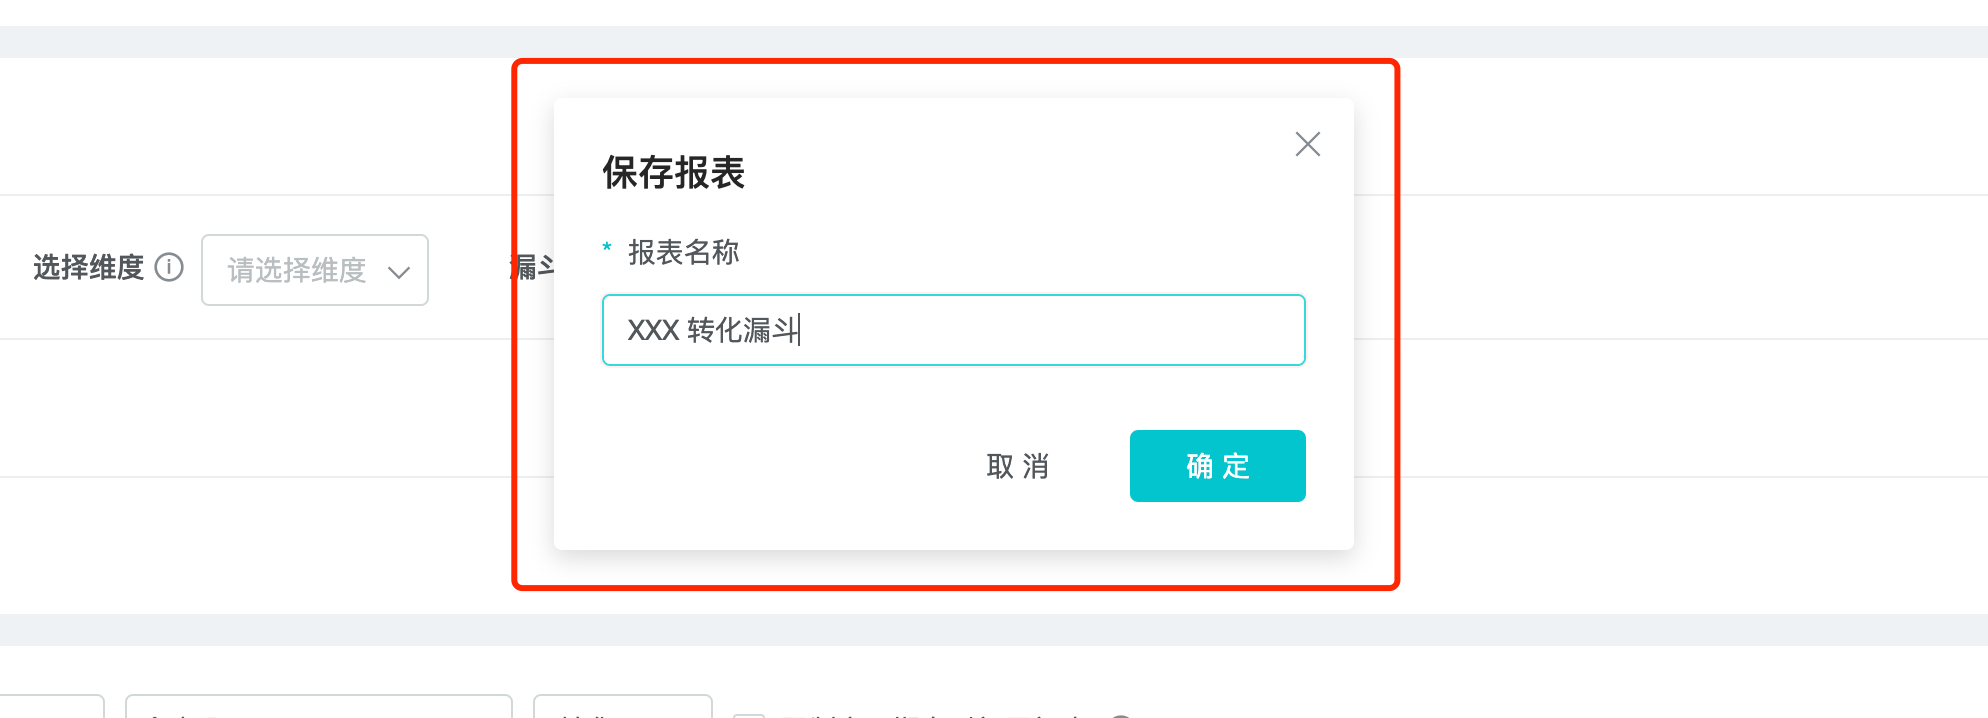
5. Save report: Save the query results as a report, and then create a dashboard based on the report. A dashboard makes it easy to view analysis results.
2. What Is Funnel Analysis
Funnel analysis is to analyze the conversion rate of users from the starting point to the end point, which is used to measure the conversion effect of each node. In an ideal situation, the user will follow the path of the product design to reach the final target event, but the reality is that the user's behavior path is diverse.
By configuring the critical business path through buried events, it can analyze the user conversion and churn. This function can not only identify potential problems with the product, but also locate the loss of users in each link, so as to facilitate the subsequent conversion through product means or marketing means.
3. Use Cases For Funnel Analysis
Typical user cases of funnel analysis:
- There is a lot of traffic, but few registered users. What part of the process is the problem?
- What is the overall conversion rate from sign-up - character creation - play - pay?
- What are the differences in conversion rates between regions?
- Two promotion channels bring different users. Which channel has the highest conversion rate?
4. How To Do Funnel Analysis
There are 5 steps in the funnel analysis.
1. Set up steps
2. Setting the dimension
3. Setting the funnel period
4. Set up display results
5. Save report
4.1 Setting the funnel
On the Funnel Analysis page, click "Set Steps" to see the "Add Funnel Step" screen.
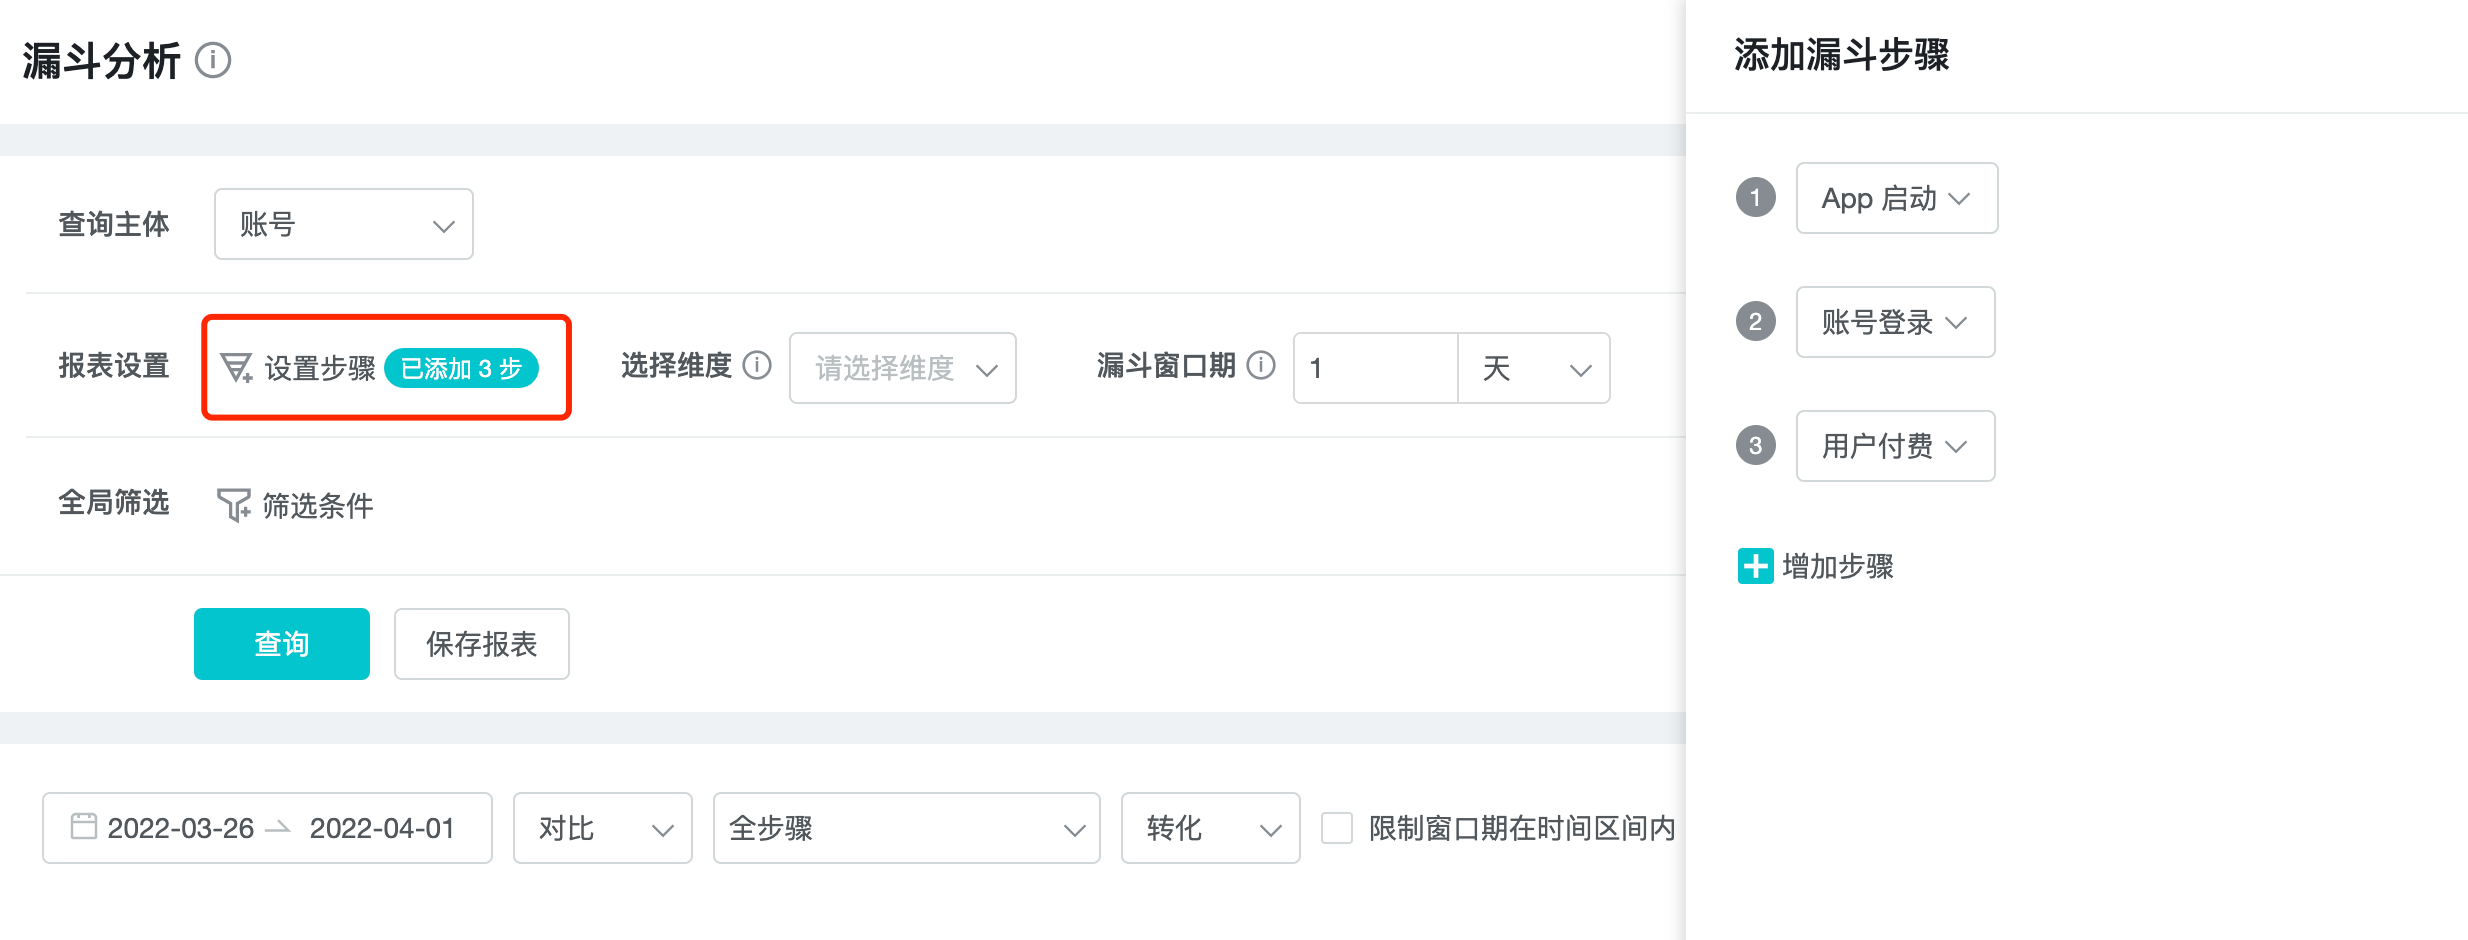
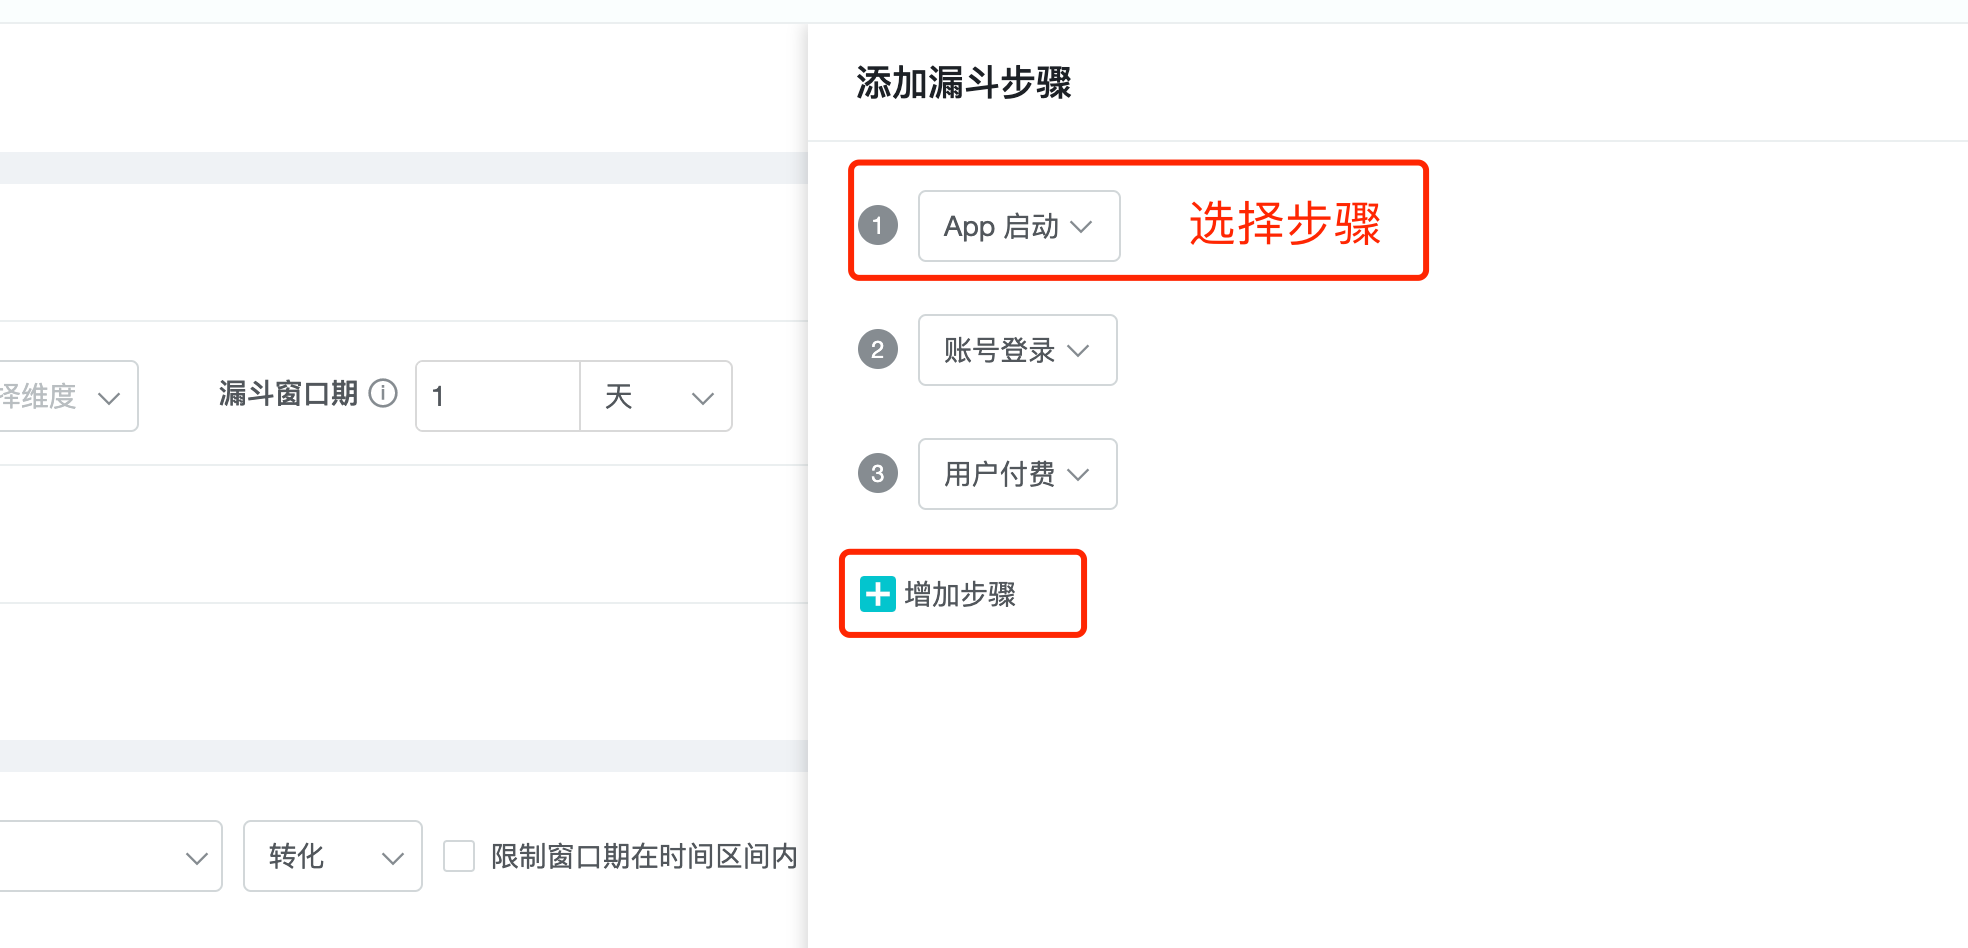
In the "Add Funnel Step" screen, you can select a funnel step and add a funnel step by.
- Step: consists of an event (one or more filter conditions can be added) that represents a critical step in a conversion process.
A funnel contains at least 2 steps, each containing one event. More steps can be added, and the order of the steps can be changed by dragging the serial number in front of the step.
It is also possible to set filter conditions for the steps. You can also set global filtering in the main interface of funnel analysis.
2、Add steps: Add more steps to the funnel to be analyzed.
4.2 Set Dimension
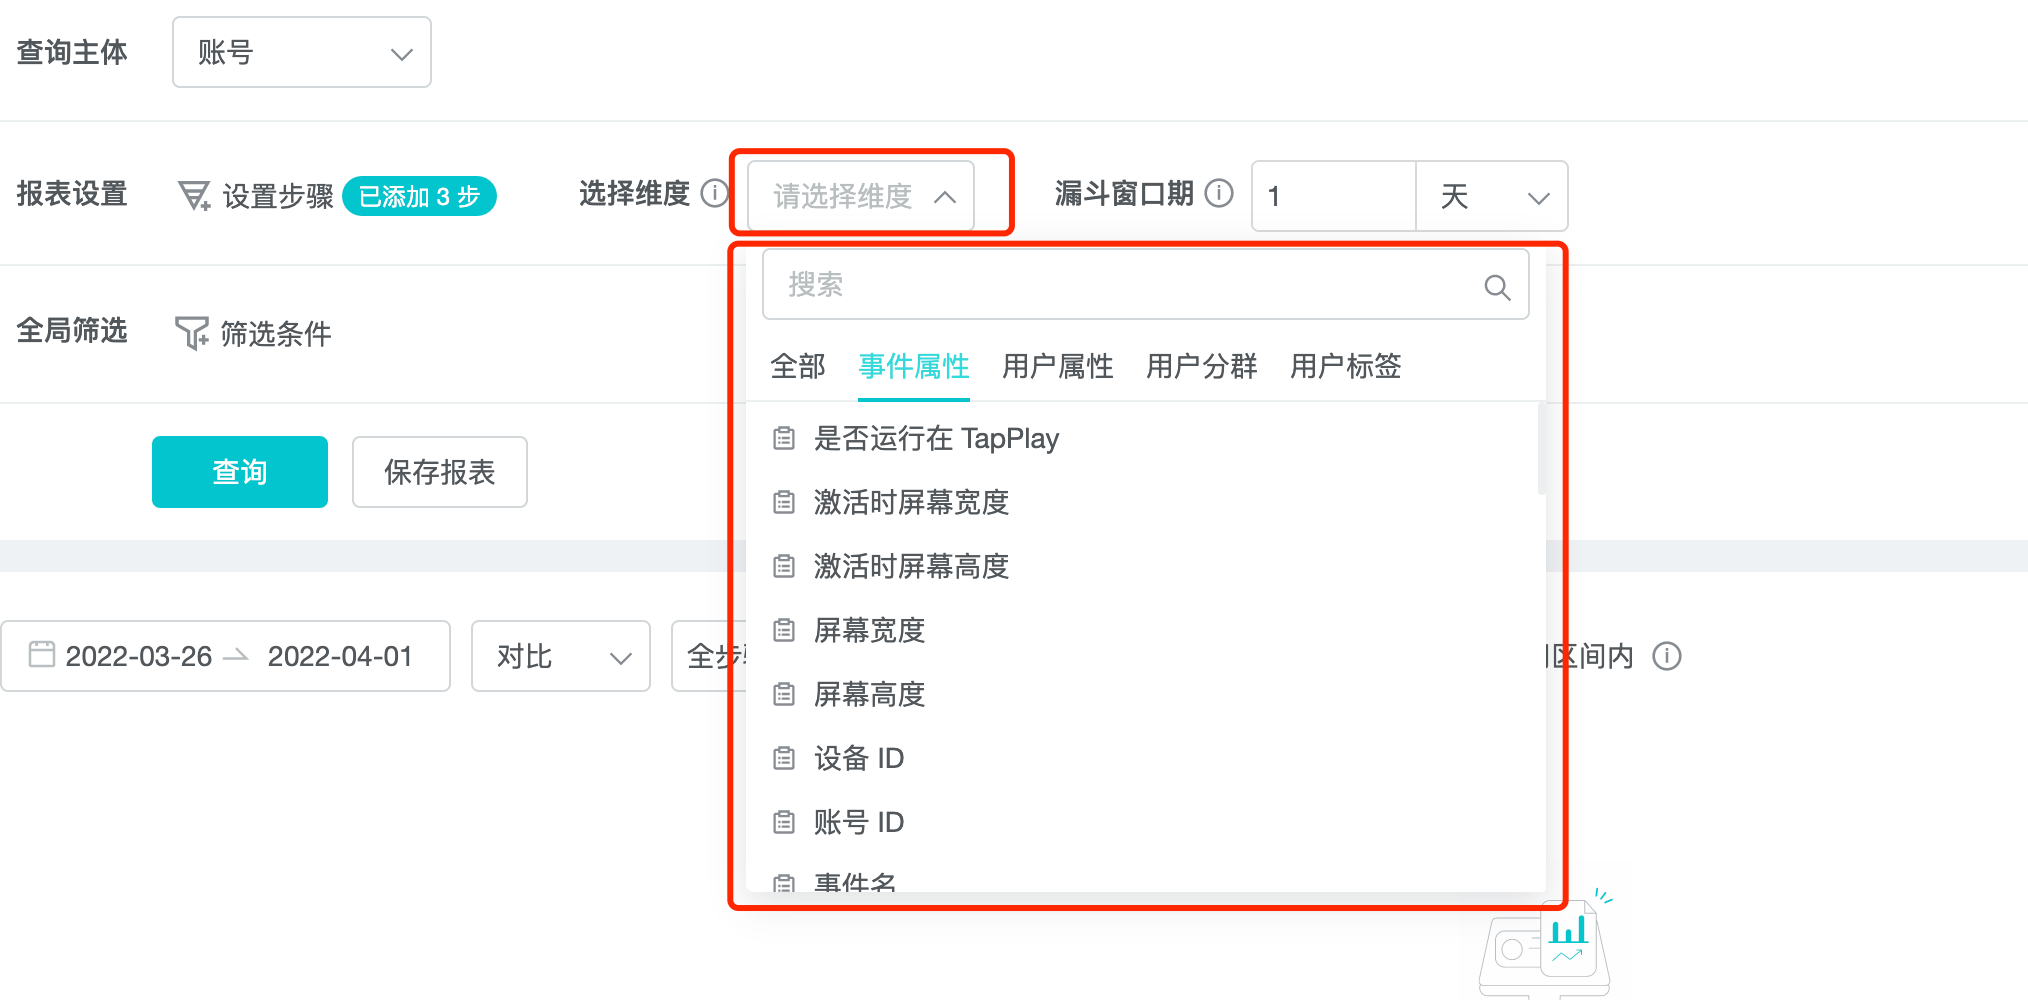
In the dimension drop-down box, the display includes event attributes (Step 1), user attributes, and user subgroups.
4.3 Set the funnel cycle
Funnel Cycle: from the time the user triggers Step 1, the completion of the subsequent steps within the window period counts as the conversion of the subsequent steps.
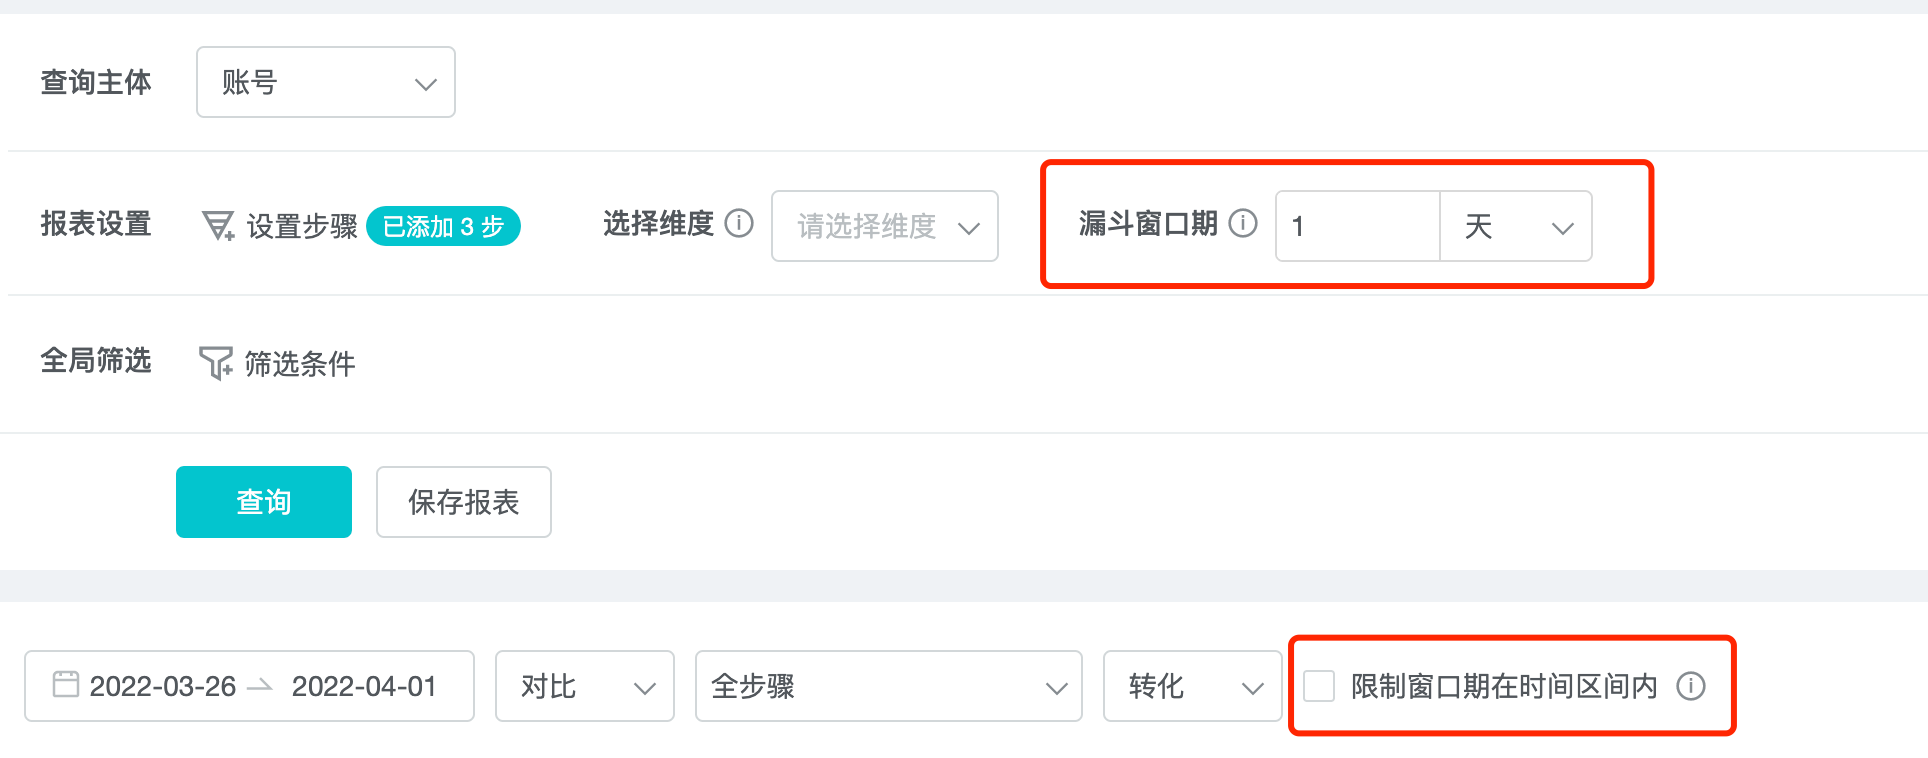
Limiting the window period within the time interval: only within this time frame, the user travels from the first step, to the last step, is considered a complete funnel conversion.
4.4 Set Display Results
You can select the range of analysis steps, and according to the "Comparison/Trend" and "Conversion/Churn" settings, you can get 4 types of reports: Conversion Comparison Table, Churn Comparison Table, Conversion Trend Table, and Churn Trend Table.

Conversion comparison table: to analyze the cumulative conversion rate from step 1 to the subsequent steps.

Churn comparison table: to analyze the churn rate between each step.

Conversion trend table: to analyze the trend of conversion rate by date.

Churn trend table: to analyze the trend of attrition rate by date

4.5 Save to Dashboard
Save the query results as a report, and then create a dashboard based on the report. A dashboard makes it easy to view funnel analysis results.
5. Funnel Analysis Principle
The funnel analysis will be explained in detail next, especially when there are grouping and filtering cases, the calculation principle will be more complicated.
5.1. Basic calculation principle
Suppose a funnel consisting of steps 1, 2, 3, 4, and 5 is selected for the time range March 1, 2021 to March 7, 2021, with a window of 3 days. If a user triggers step 1 from March 1, 2021 to March 7, 2021, and triggers steps 2, 3, 4, and 5 in sequence within the 3 days of step 1, the user is considered to have completed a complete funnel transformation, and if steps 1 > 2 > 4 > 5 are triggered in sequence, the user has completed only step 1 > 2.
If the steps are interspersed with some other steps, such as 1 > X > 2 > X > 3 > 4 > X > 5 (where X represents other events), the user is still considered to have completed a complete funnel transformation.
When a user has multiple events in the selected time period that all meet the definition of a certain conversion step, the event closer to the final conversion goal is preferred as the conversion event, and the conversion calculation stops when the final conversion goal is reached for the first time.
Assuming that the steps of a funnel are defined as: Browse Mall, Select Prop, Generate Order, Pay Success, then the sequence of different user behaviors and the actual conversion steps (bolded parts) are as follows.
Example 1: Browse mall > Select prop (prop B) > Select prop (prop A) > Generate order > Pay successfully
Example 2:Browse the mall > Select prop (prop B) > Browse the mall > Select prop (prop A) > Generate order > Payment success
Example 3:Browse mall > Select prop (prop B) > Browse mall > Select prop (prop A) > Generate order > Payment successful > Select prop (prop A) > Generate order > Payment successful
The numbers presented in the funnel analysis represent the number of unique users converted/lost, not the number of events triggered. Within this time frame, even if a user completes the funnel multiple times, it is only counted once.
5.2 Grouping and Screening
The grouping and filtering of funnel analysis are based on the users who have completed conversions/lost.
Grouping and filtering based on user attributes and user subgroups: Grouping and filtering based on user attributes and user subgroups based on users who have completed conversion/lost.
Grouping and filtering based on event attributes: Grouping and filtering based on the event attributes of the user in step 1 based on the users who completed conversion/lost.