Alert Management
1. Overview
Construct a set of time series data by setting indicators and filtering grouping items. Timely query and compare with historical data according to time granularity, and notify project team members after triggering alert rules.
Currently, we support setting indicators in the form of "event analysis" and alert notification by email.

2. Applicable Roles and Uses
| Roles | Uses |
|---|---|
| Analyst / Business Person | To monitor key or abnormal data for early warning, grasp product dynamics in real time, and can find abnormal problems at the first time |
3. New Data Alert
Click New Alert in the upper right corner of the alert list.

3.1 Basic Information
In the "Basic Information" section, enter or select the warning name, query object and warning indicator in turn.

The alert name is displayed in the alert list, which is the basis for identifying an alert.
The query subject can choose "Account" or "Device", similar to the query subject in "Event Analysis".
3.2 Early warning rules
3.2.1 Adding alert rules
In the warning rule, you can select the grouping dimension and construct multiple groups of time series data at the same time by multi-selecting the grouping value. When there is no grouping dimension, the default grouping item is "Total".

The relationship between the optional alert time granularity, comparison base and parameter types are listed in the following table.
| Time granularity | Comparison Basis | Parameter Type |
| Day | Fixed value | Value |
| Previous day, same day as last week | Value, percentage | |
| Past 7-day average, past 30-day average | Value, percentage, standard deviation | |
| Hour | Fixed values | Value |
| Previous hour, same hour yesterday | Value, percentage | |
| Past 24 hour mean | Value, percentage, standard deviation |
每个预警下可同时设置多条预警规则,每个预警规则下可添加多个分组。
3.2.2 Alert Rule Details
Value
When fixed value is used as the comparison base:
-
High: actual value of indicator > Numerical value
-
Low: actual value of indicator < value
When non-fixed values are used as the comparison benchmark:
-
High: actual value of the indicator > the benchmark + the value
-
Low: actual value of the indicator < the benchmark - the value
Percentage
-
High: actual value of indicator > benchmark * (1 + percentage)
-
Low: actual value of indicator < benchmark * (1 - percentage)
standard deviation
-
High: actual value of indicator > comparative benchmark + parameter * standard deviation
-
Low: actual value of indicator < comparative benchmark - parameter * standard deviation
For example, the standard deviation of the "average value for the past 7 days" is the standard deviation of the actual value of the indicator for each day of the past 7 days.
3.3 Notification settings
Currently, we support email notification, and we will open various notification methods such as webhook, SMS and in-site notification.

Enter user email and press enter to confirm the entry, multiple emails can be entered.
4. Warning Notification
According to the time granularity set for each warning rule, the system will query the warning indicator at the end of each day or hour according to the set grouping.
An email will be sent to the entered mailbox after the alert rule is triggered, as follows.

5. Alert Management
5.1 Alert List Management
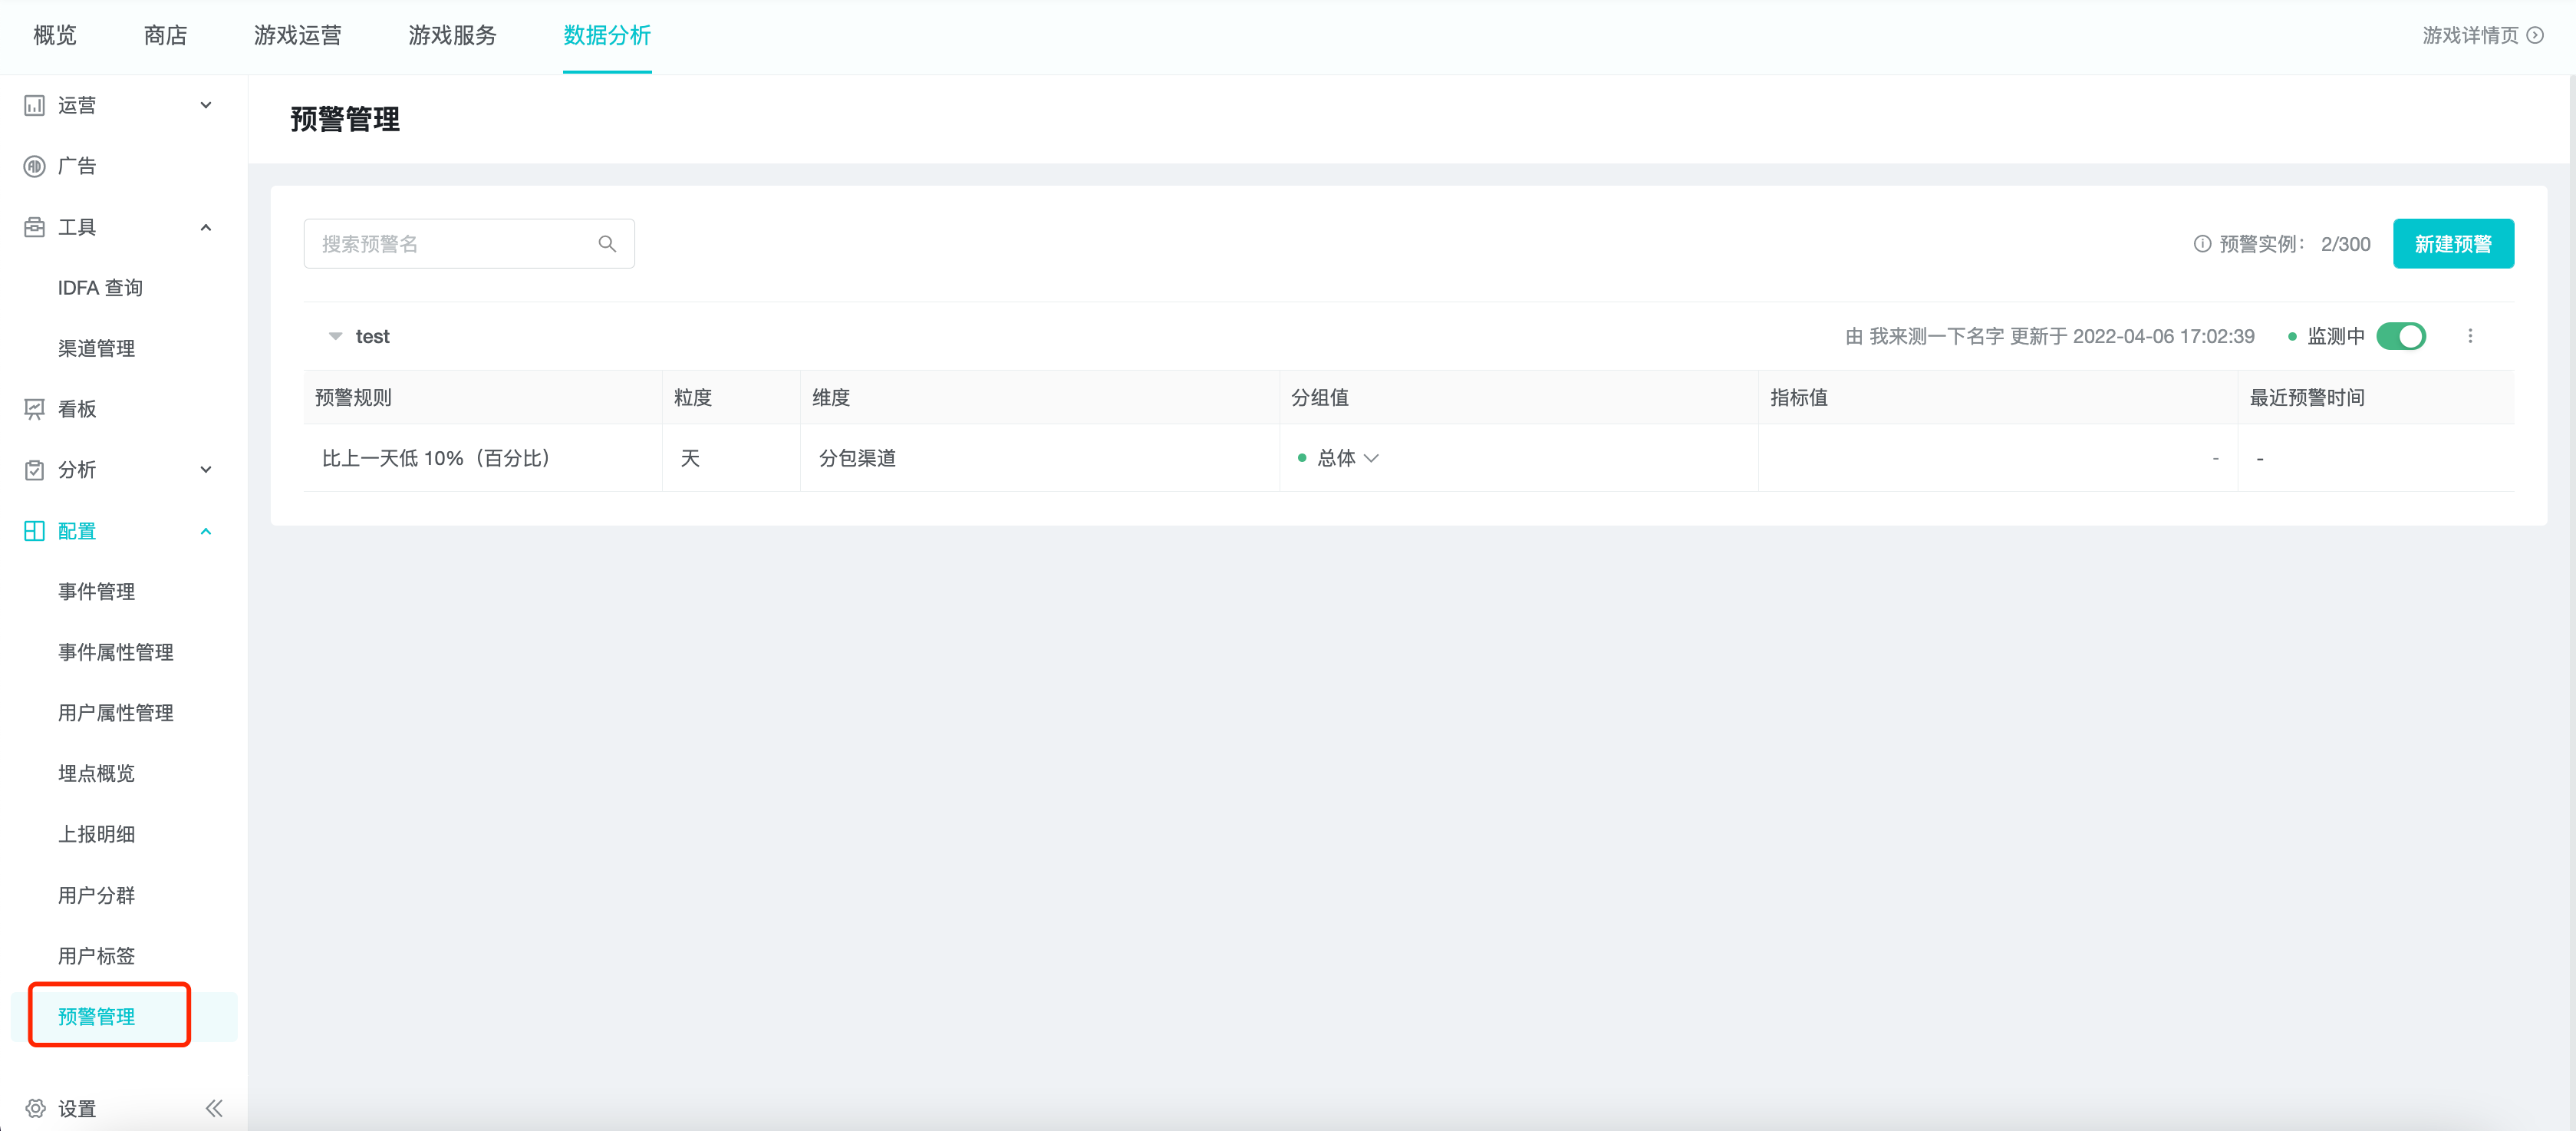
The created alerts are displayed as a list in the data alert page, and you can view, start/pause, edit, copy, delete, etc.

The progress of using data alert is based on "alert instance" as the most basic unit. One grouping under the alert rule is one "alert instance", the maximum number is 30, and the usage progress can be released by deleting the alert or unchecking the grouping.
5.2 Alert details
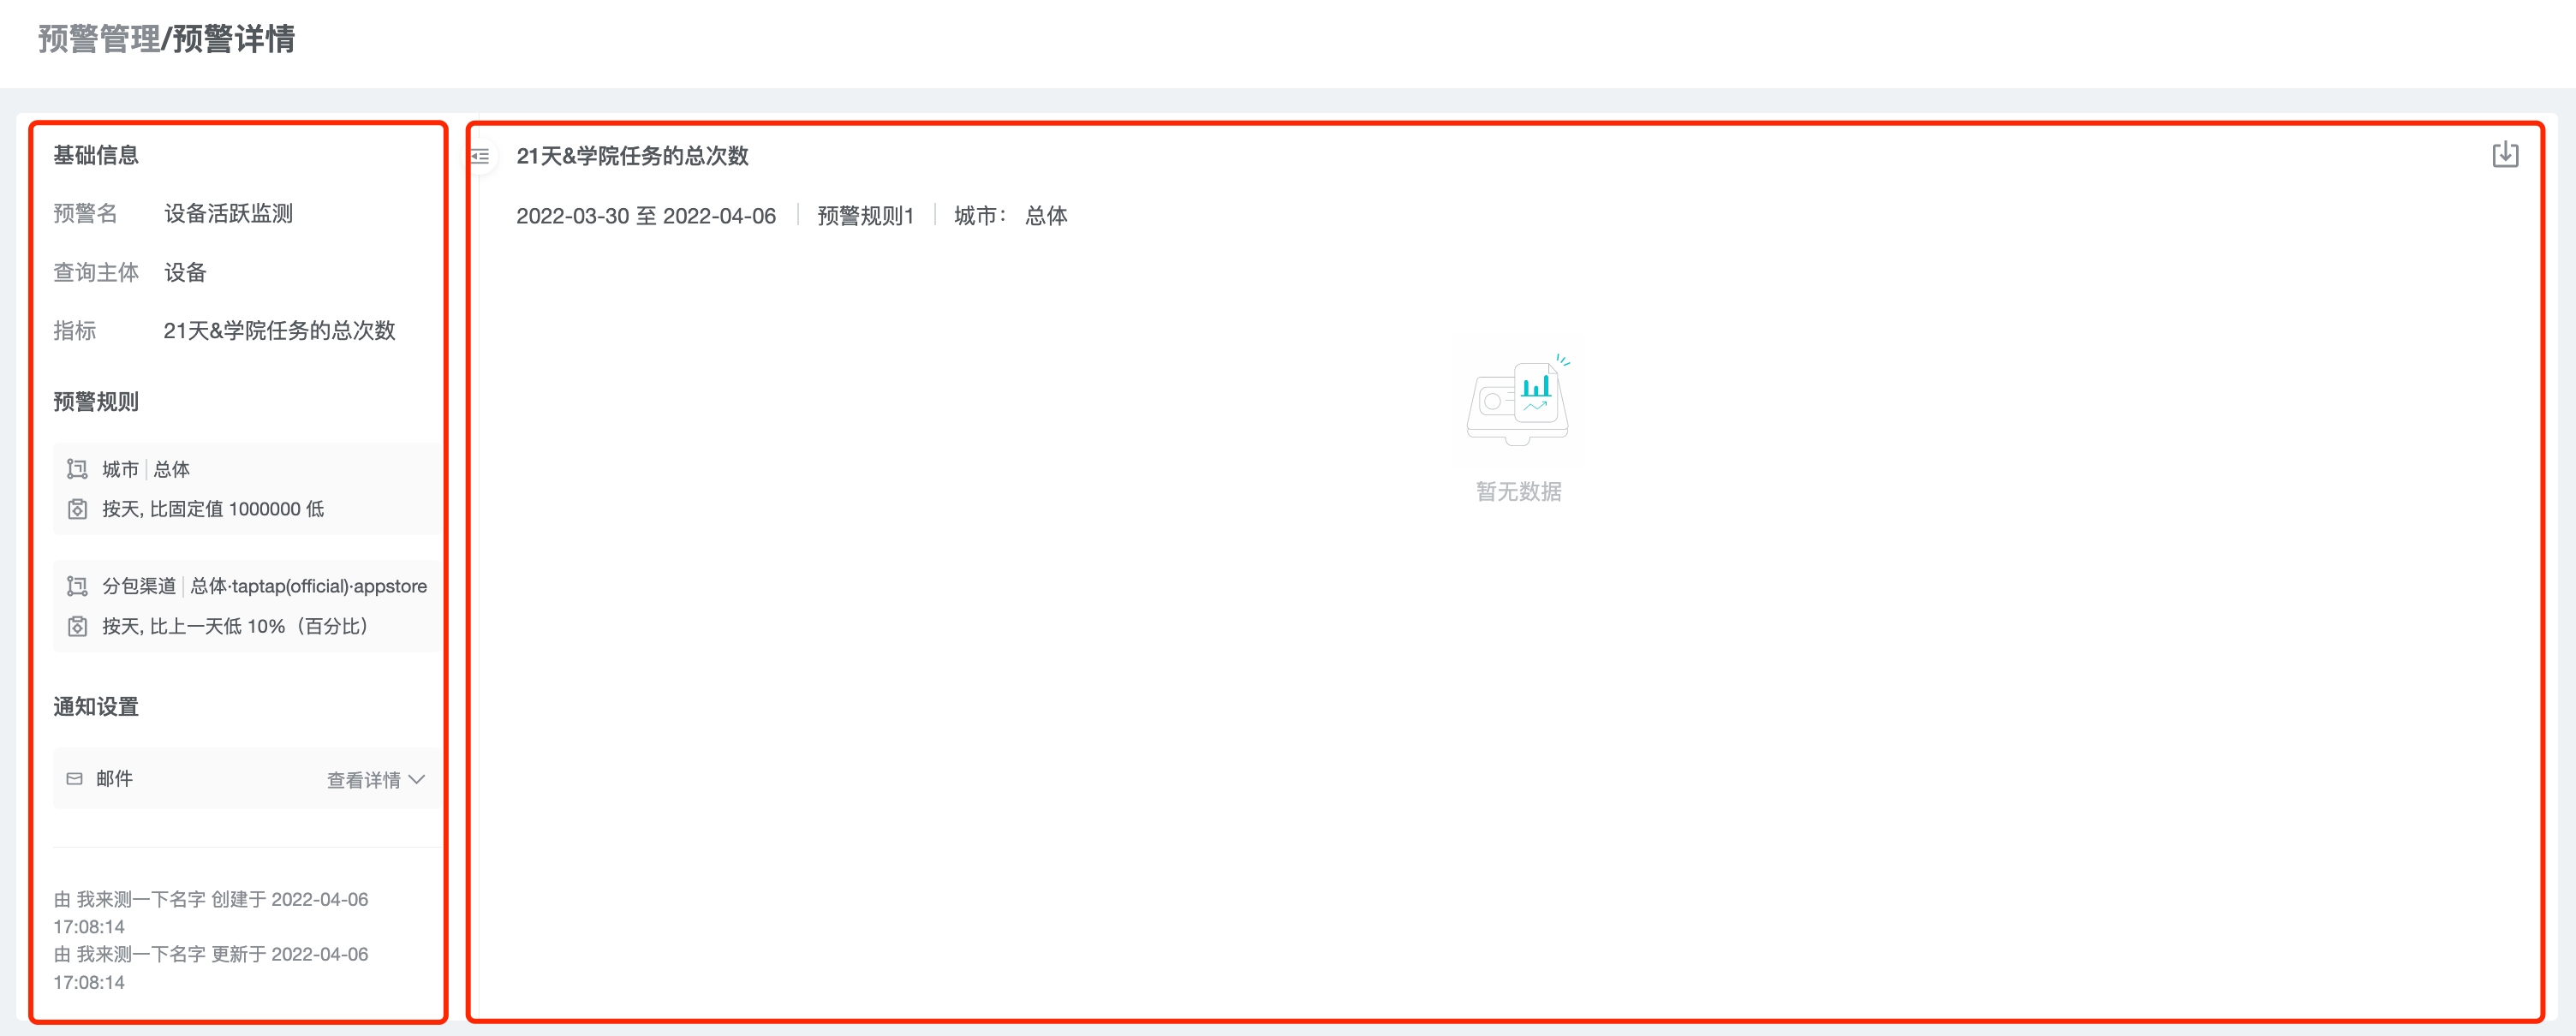
Click the alert name and alert rule to jump to the detail page, and filter the alert rule.

On the left side of the page, you can see the "Basic Information", "Alert Rules" and "Notification Settings" of the alert.
On the right side of the page, you can see the historical trend graph and data table of the current filtered alert rules and grouping data, and the time when an alert occurred is marked in the trend graph as a red dot.

6. Best Practice
6.1 Monitoring performance targets by "fixed value" alert
For numerical performance targets, such as the amount of recharge and the number of active users, you can monitor whether the performance targets are achieved through "fixed value" alerts.
6.2 Through the "percentage" monitoring indicators month-on-month and year-on-year changes
For daily operation indicators, such as number of active users and number of new users, you can closely monitor their trends through "percentage" alerts, so that you can pay attention to them in time if there are abnormal trends.
6.3 Monitor short-term abnormal changes with long-term trend through "Standard deviation" alert
For indicators with long-term growth or decay, "standard deviation" alert can eliminate the influence of long-term trends on short-term changes, so as to monitor the short-term abnormal changes of the indicator.
6.4 Monitoring alert intervals
For some important indicators, such as the number of active users, multiple alert rules can be created to monitor whether the performance target is achieved, the trend of change, etc. Two rules can be created for the same kind of monitoring rules, "high" and "low", to monitor the change interval of indicators.
6.5 Multi-group alerting to detect abnormal data dimensions
For some indicators that have changed abnormally, you can find the main dimensions that caused the change by splitting them into groups for further drill-down analysis.