Distribution Analysis
1. Case Introduction
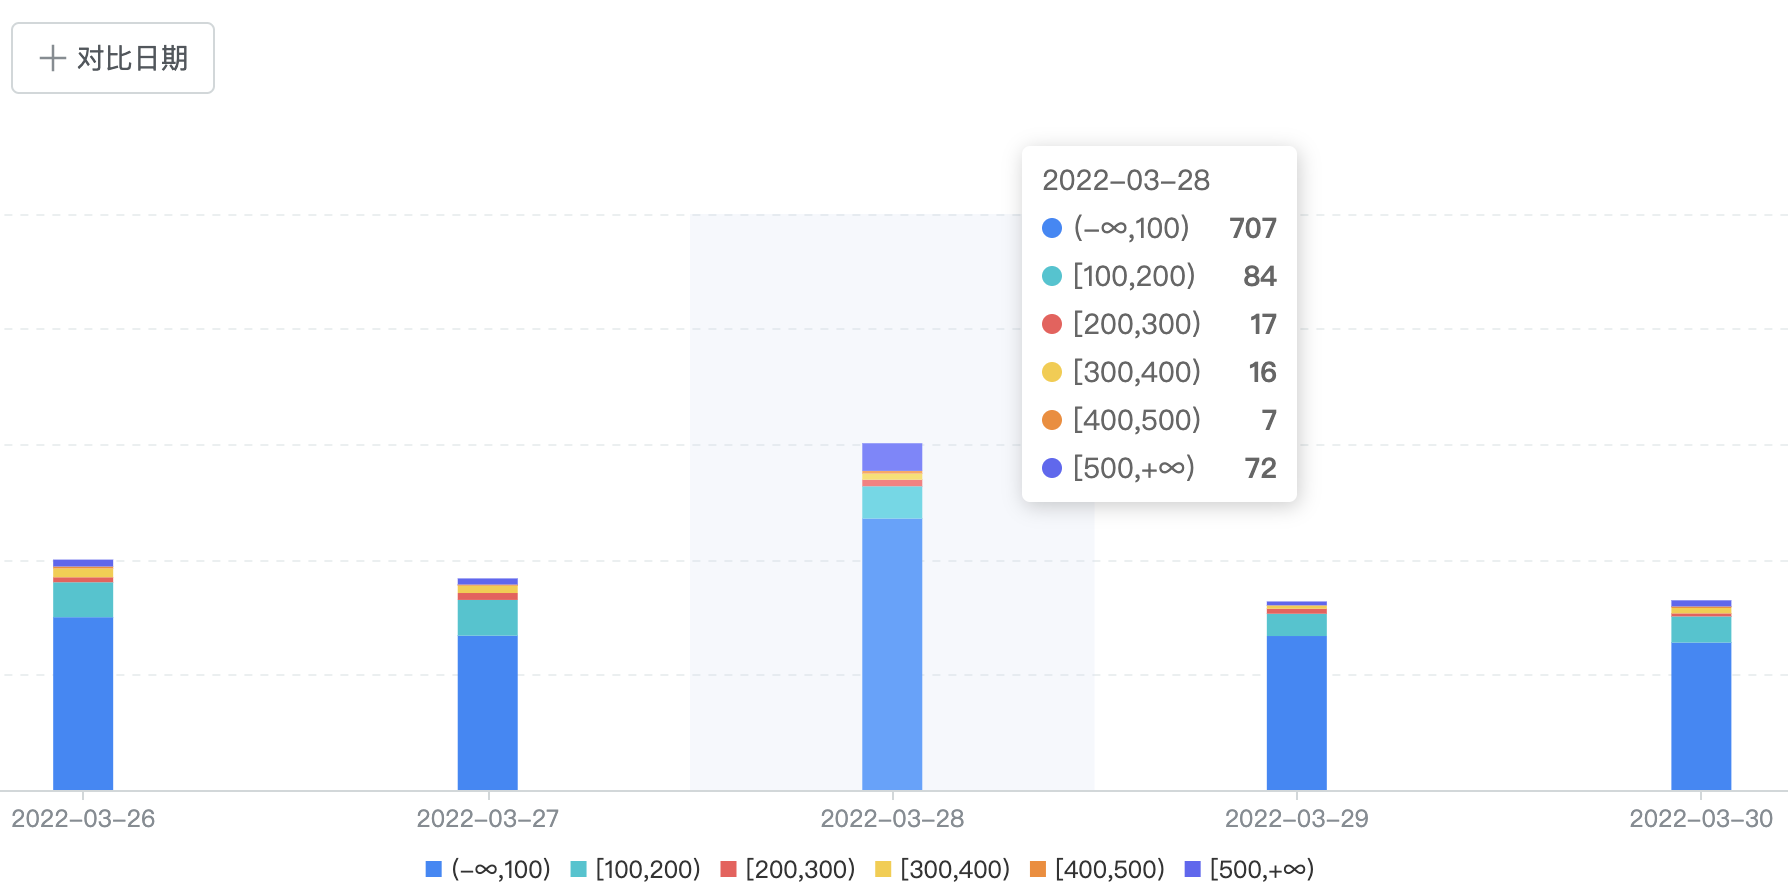
Player payment is a very important in-game behavior, and we want to know the distribution of the total amount paid by players in the game in the recent week. For example, we want to know the number of users in the range of $0-$100, $101-$200, $201-$300, etc. At this time, we can use the function of "Distribution Analysis" to show it.
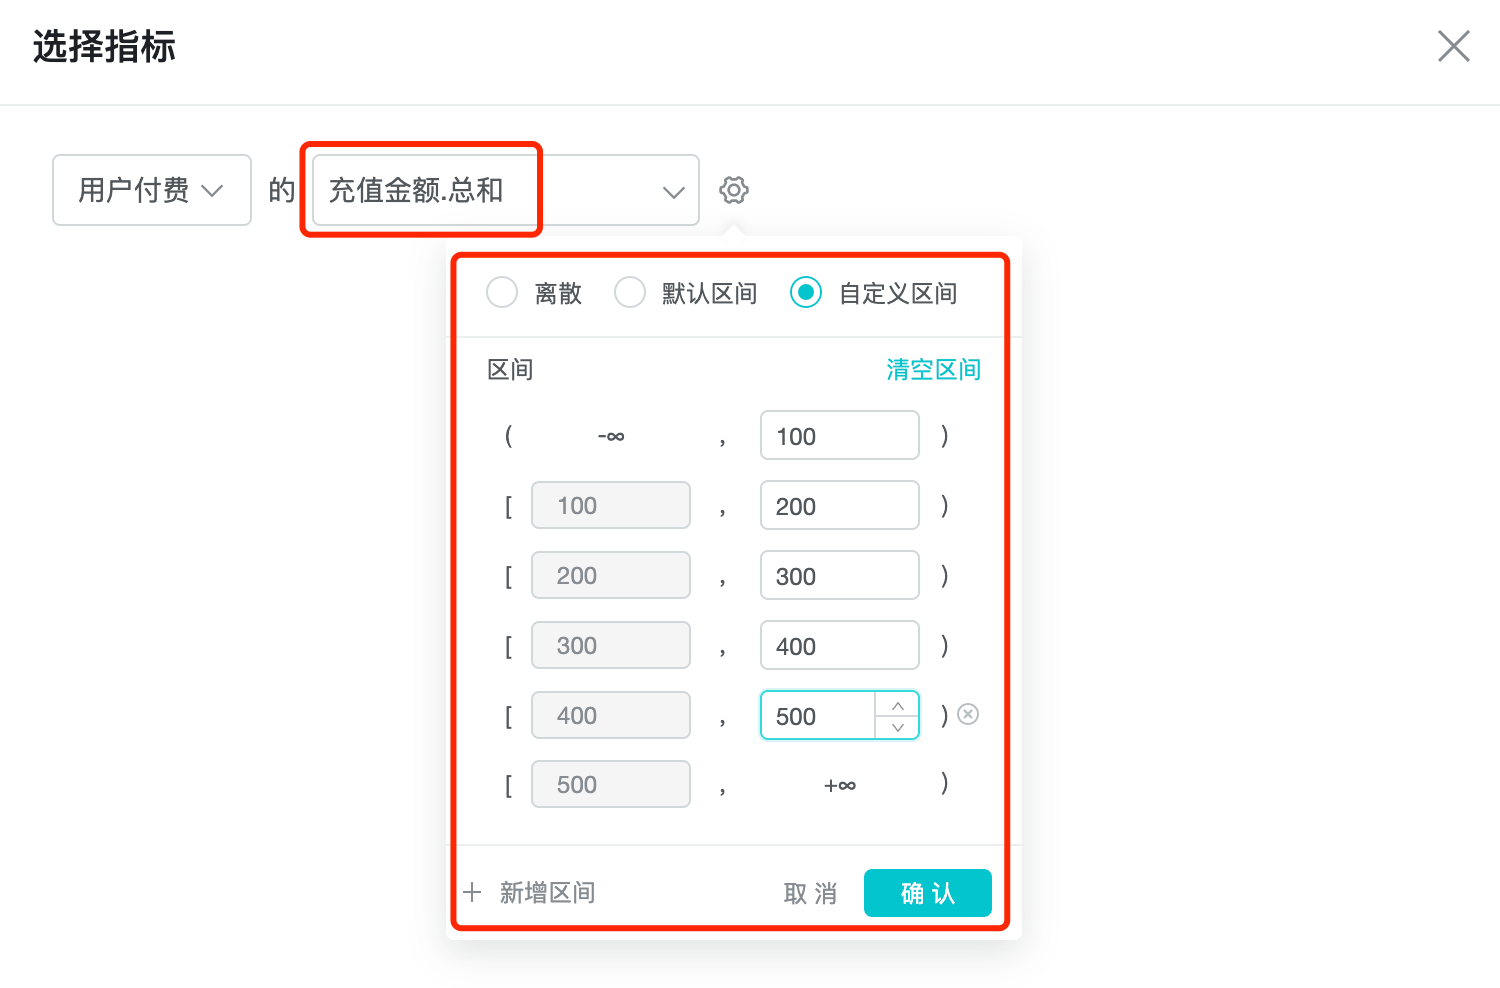
1. Setting the event: we select the event "user pays" and set a custom interval, using 100 as a segment.

2. Setting the dimension: we focus on the daily change of the amount distribution, so we choose "time of event" in the dimension.

3. Set display results: set the time period and other parameters, and click query to view the analysis results.

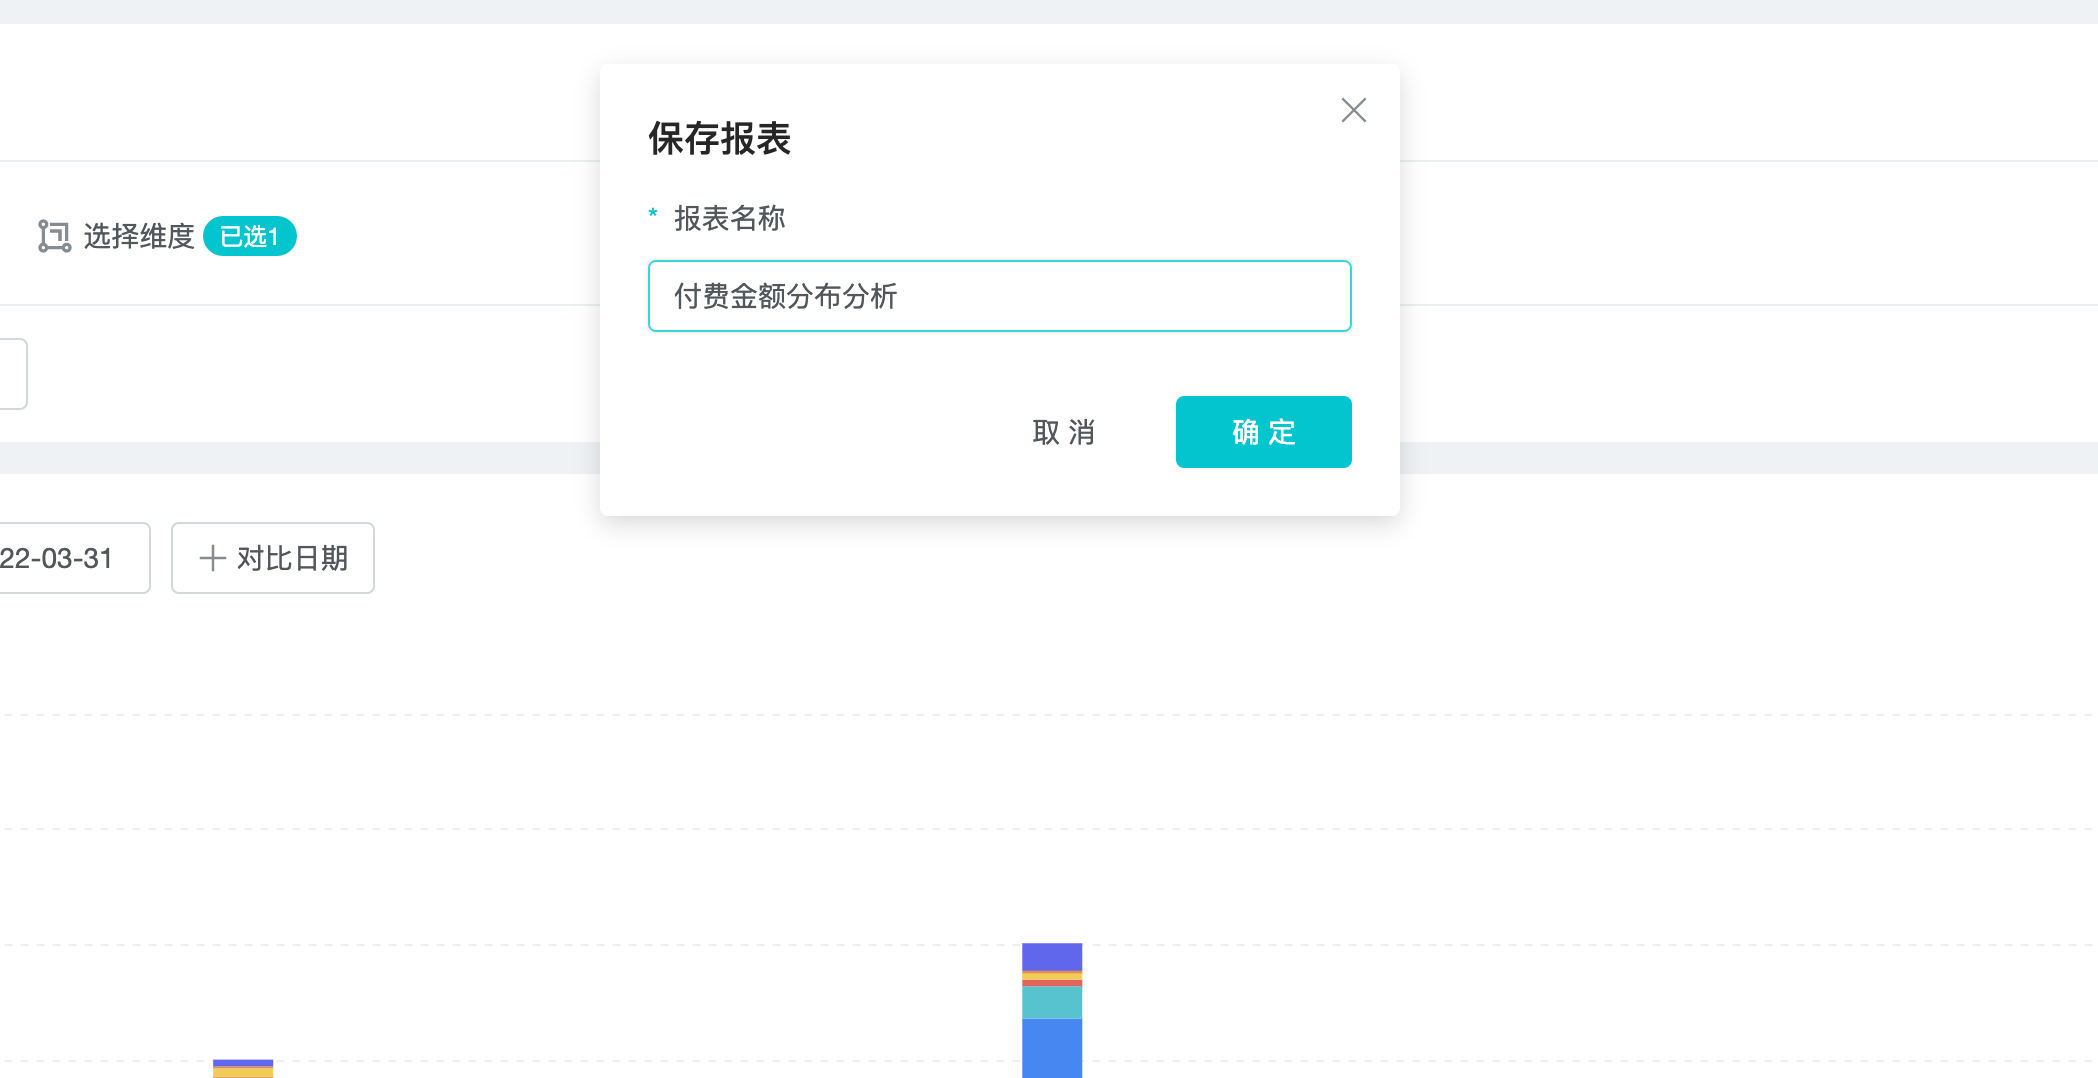
4、Save report: save the query results as a report, and then create a dashboard based on the report. A dashboard makes it easy to view analysis results.

2. What Is Distribution Analysis
Distribution analysis function is mainly used to understand the frequency of events in different zones, the cumulative sum of different event calculation variables, and the distribution of the number of users in different zones such as the length of page views.
3. Use Cases For Distribution Analysis
Typical user cases of funnel analysis:
- Did the number of users playing the game per day increase after the new version was launched?
- What are the differences in the number of users from different advertising channel sources in different amount ranges, e.g. range of $0-100, $101-200, $201-300.
- What are the differences in the distribution of hours played by different levels of players (new players, average players, heavy players).
4. How To Do Distribution Analysis
There are 4 steps in distribution analysis: setting events, setting dimensions, setting display results, and saving reports.
The last three steps are described in detail in Event Analysis, so here we focus on setting events.
On the distribution analysis page, click "Select Indicator" to see the indicator selection screen. Click Event Analysis to see how to set indicators. Click the "Settings" button to set the display type of calculation results as "Discrete", "Default interval" and "Custom interval".
- Discrete: the system will display the distribution values under each number.
- Default interval: the system will display the default interval distribution based on the calculation results.
- Custom interval: supports setting the starting and ending values of each interval segment.

5. Distribution Analysis Calculation Principle
There are 2 types of statistics for distribution analysis, statistics by count and statistics by event attributes.
Statistics by number: statistics on the number of times a user performs an action in a day/week/month.
Statistical Indicators by Event Properties: Statistics on the value of a statistical indicator for properties of an event that occurred in a day/week/month. The statistical indicators for the properties are the same as for the event analysis, with sum, mean, maximum, minimum, and de-duplicated numbers.